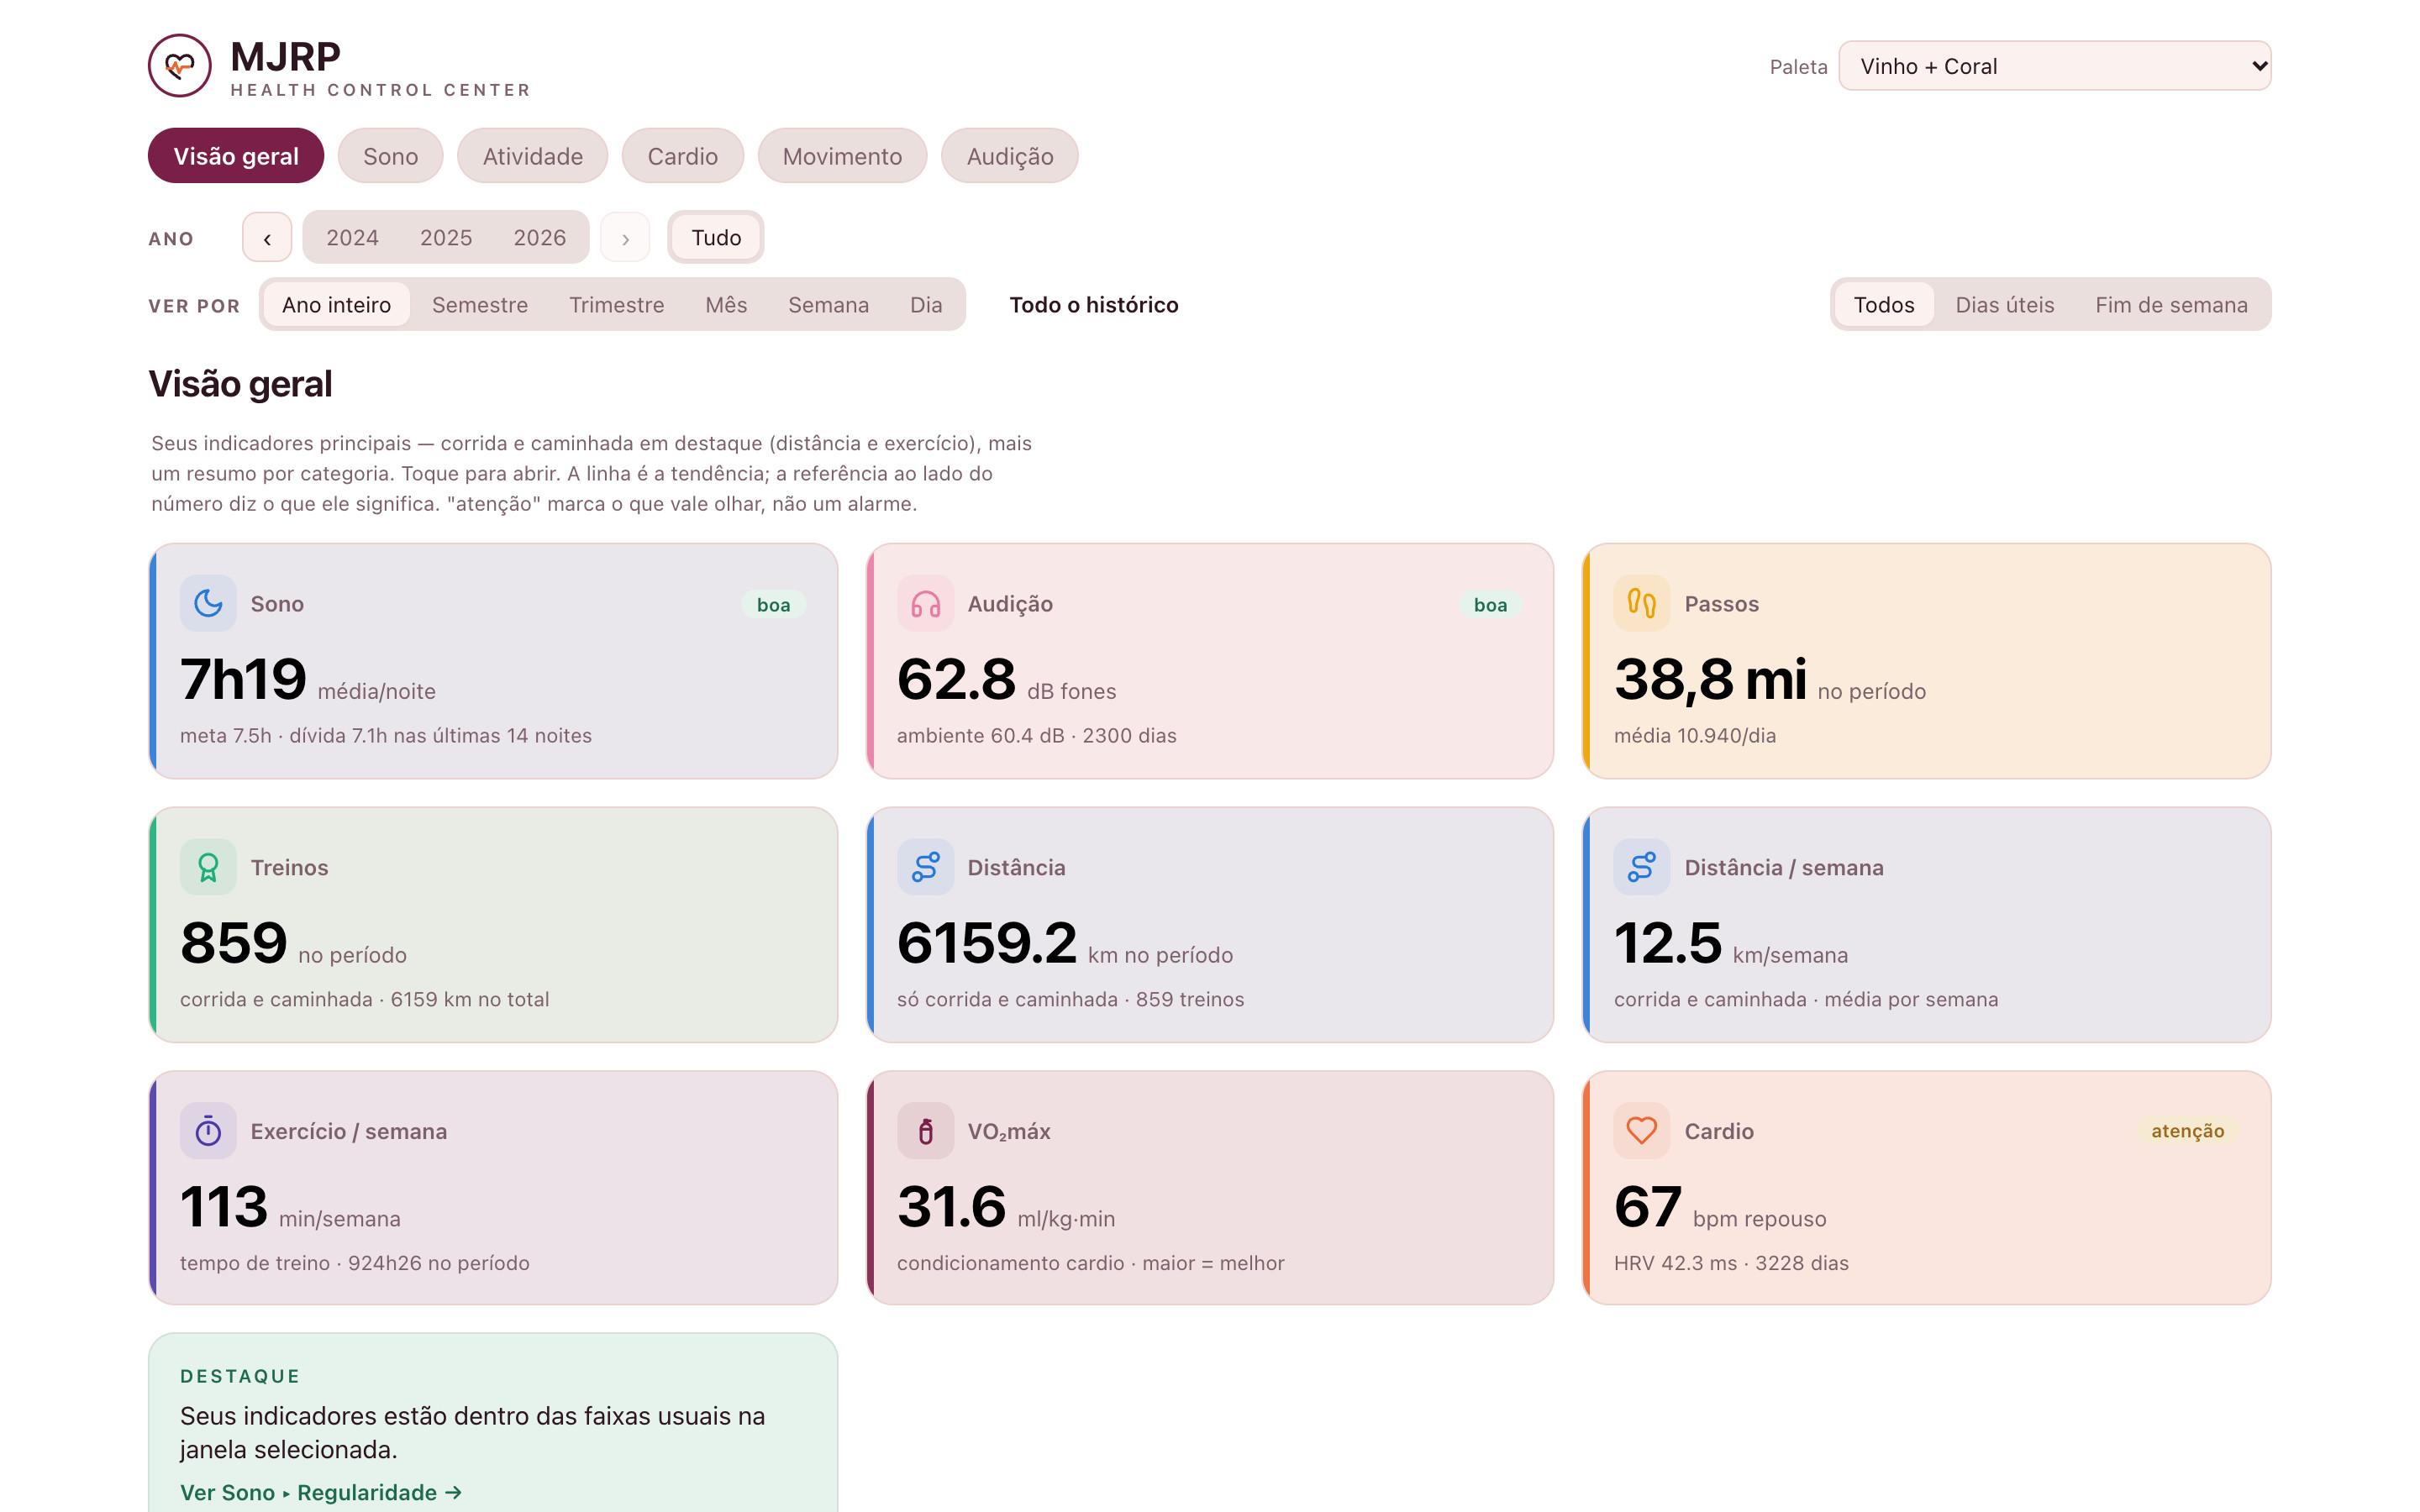
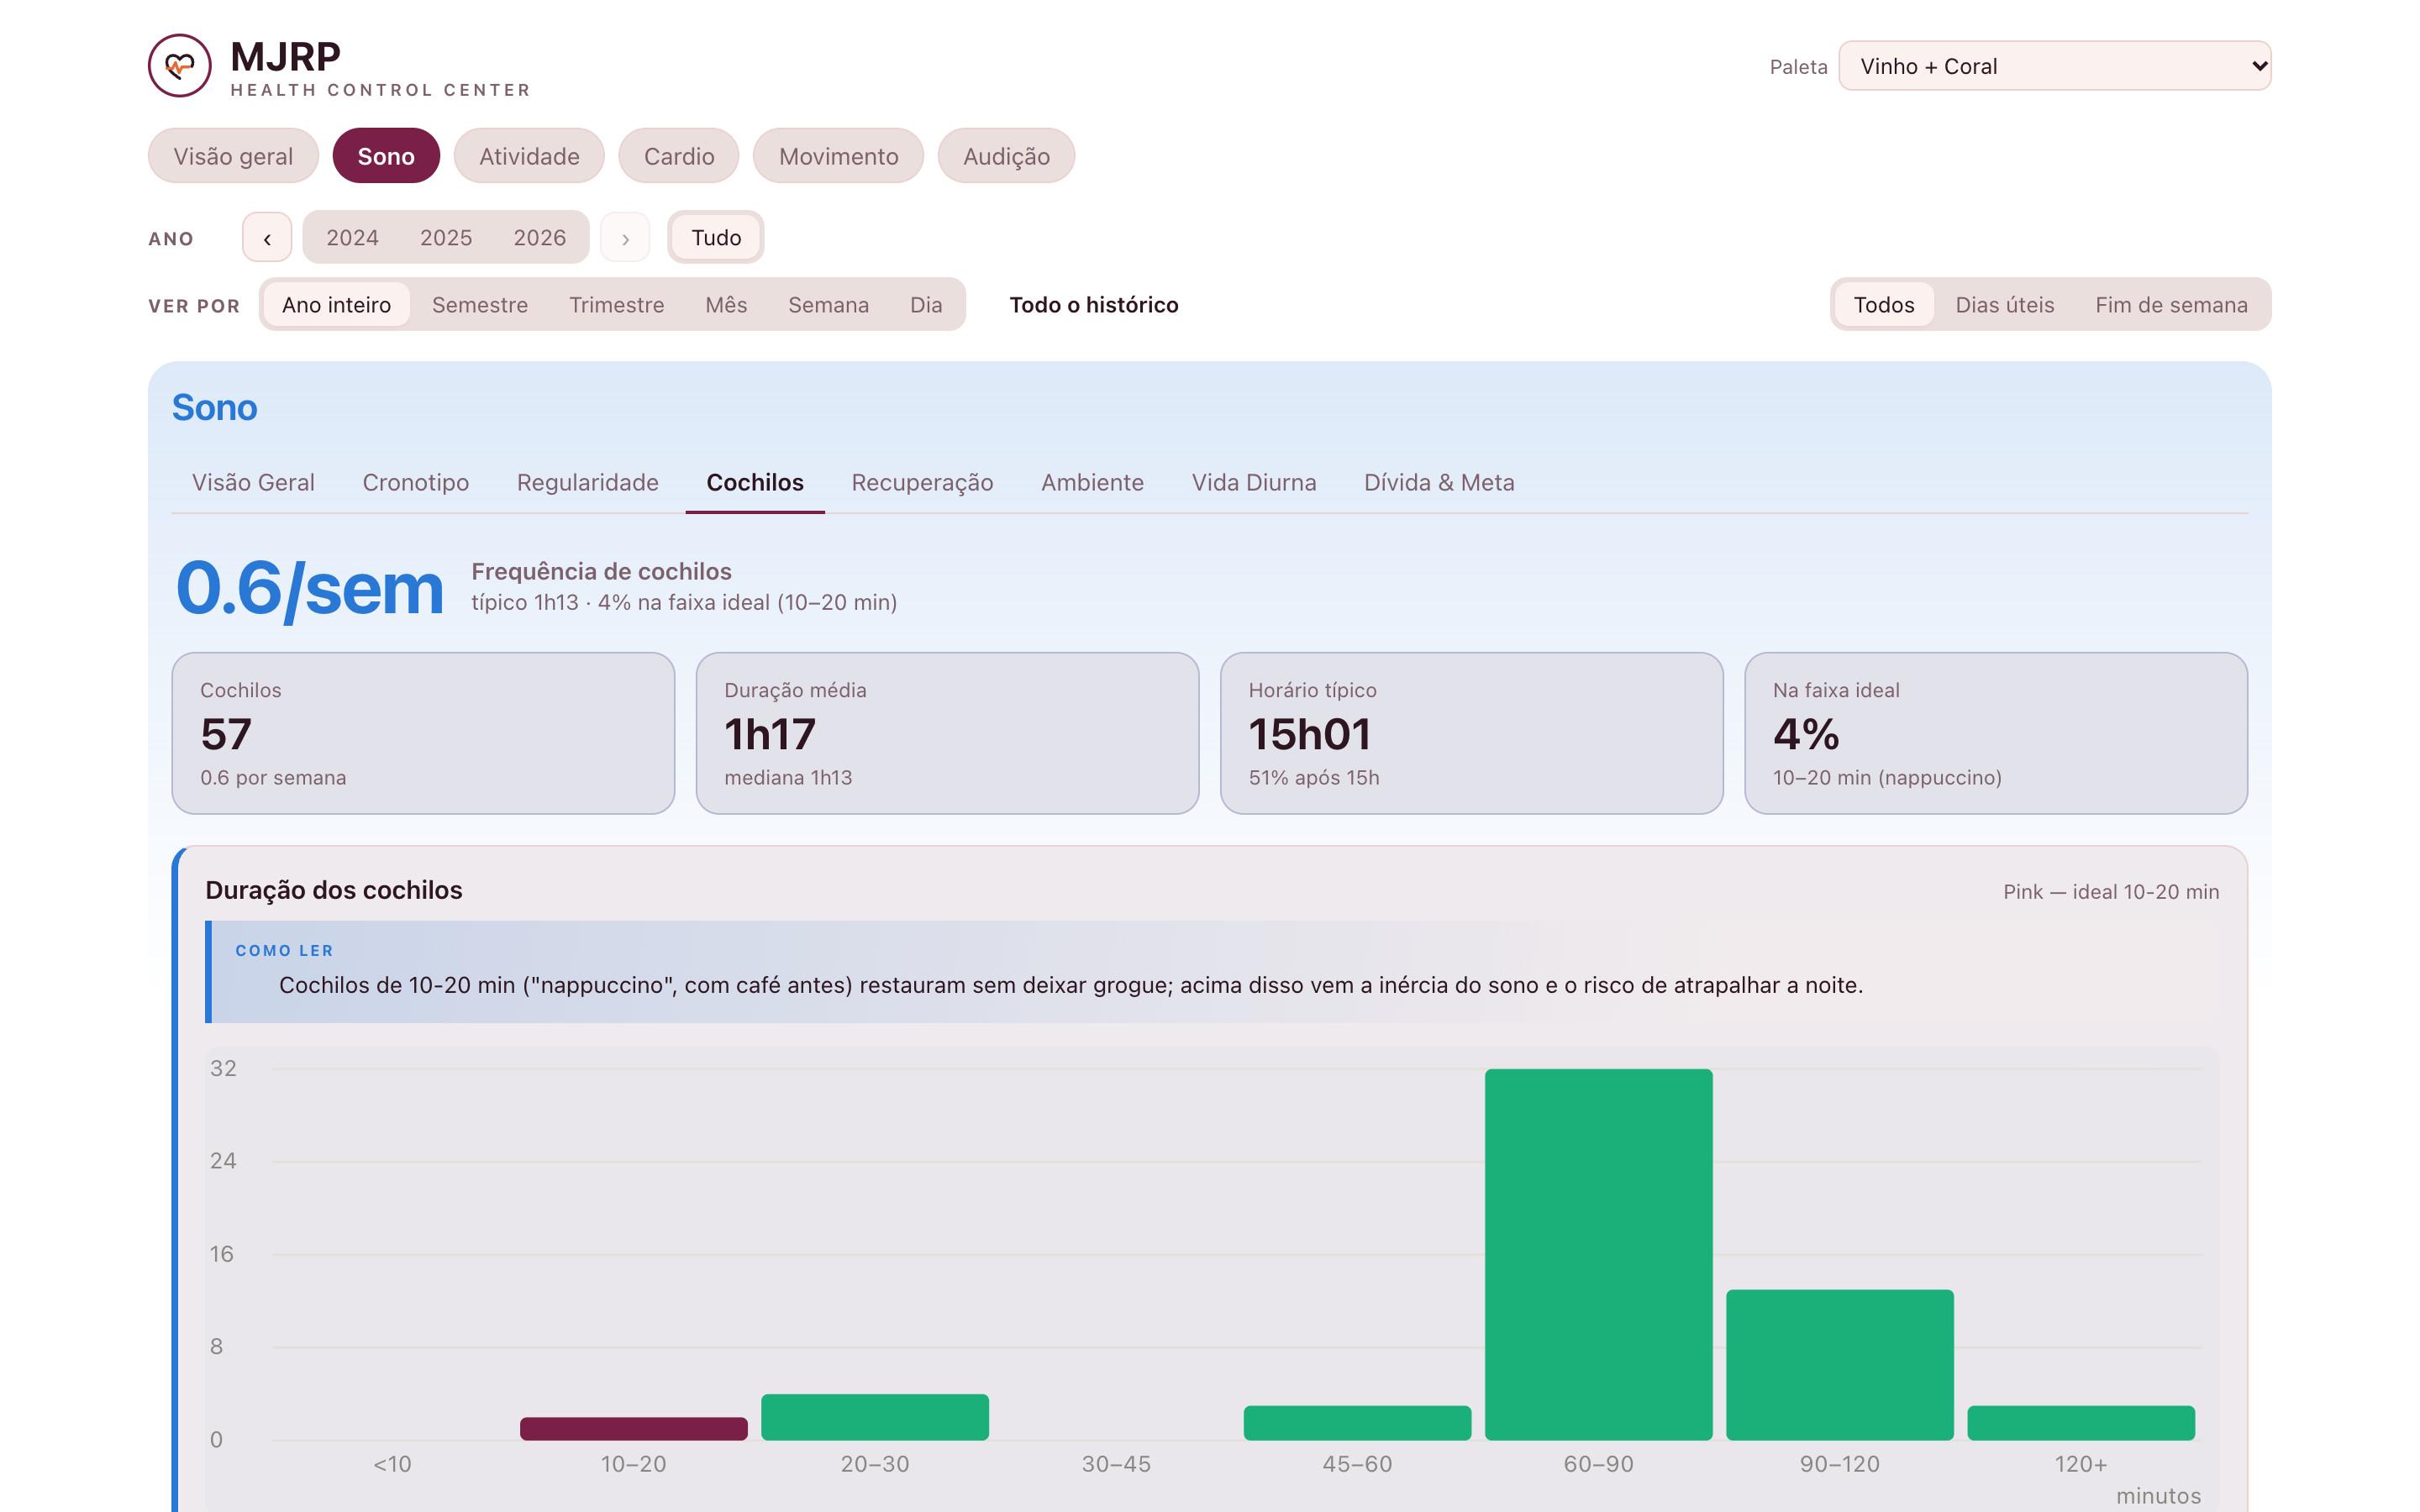
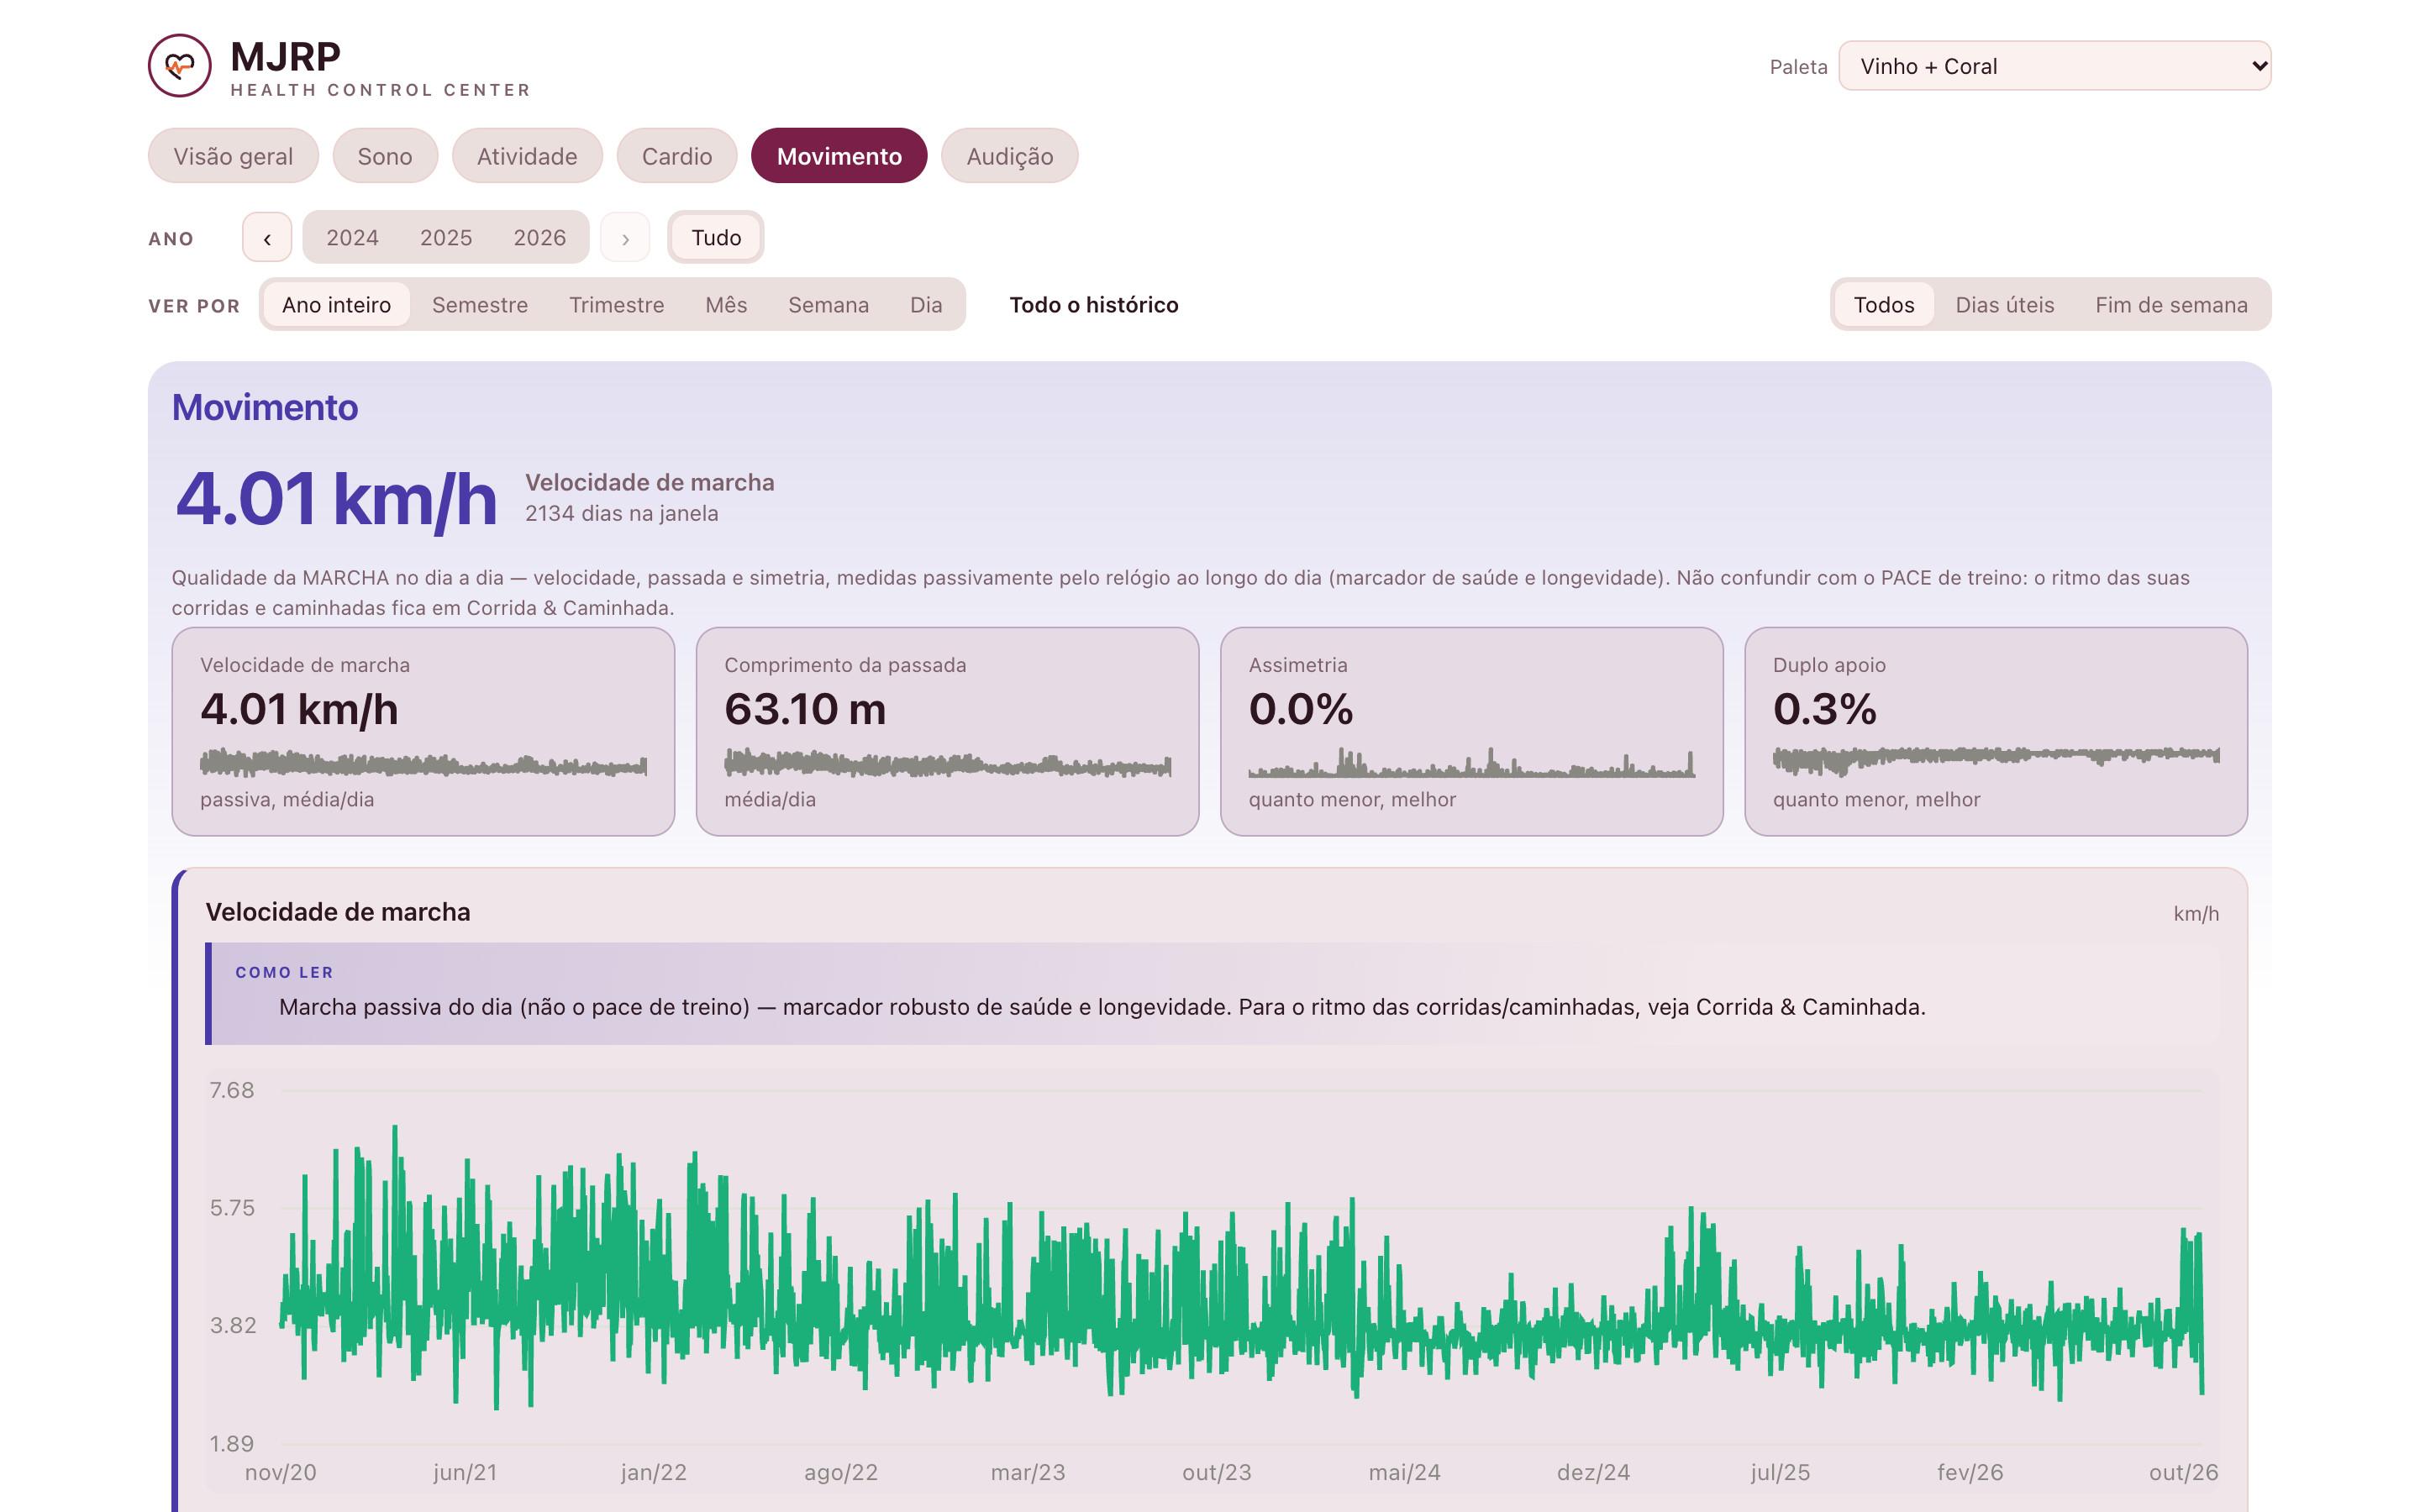
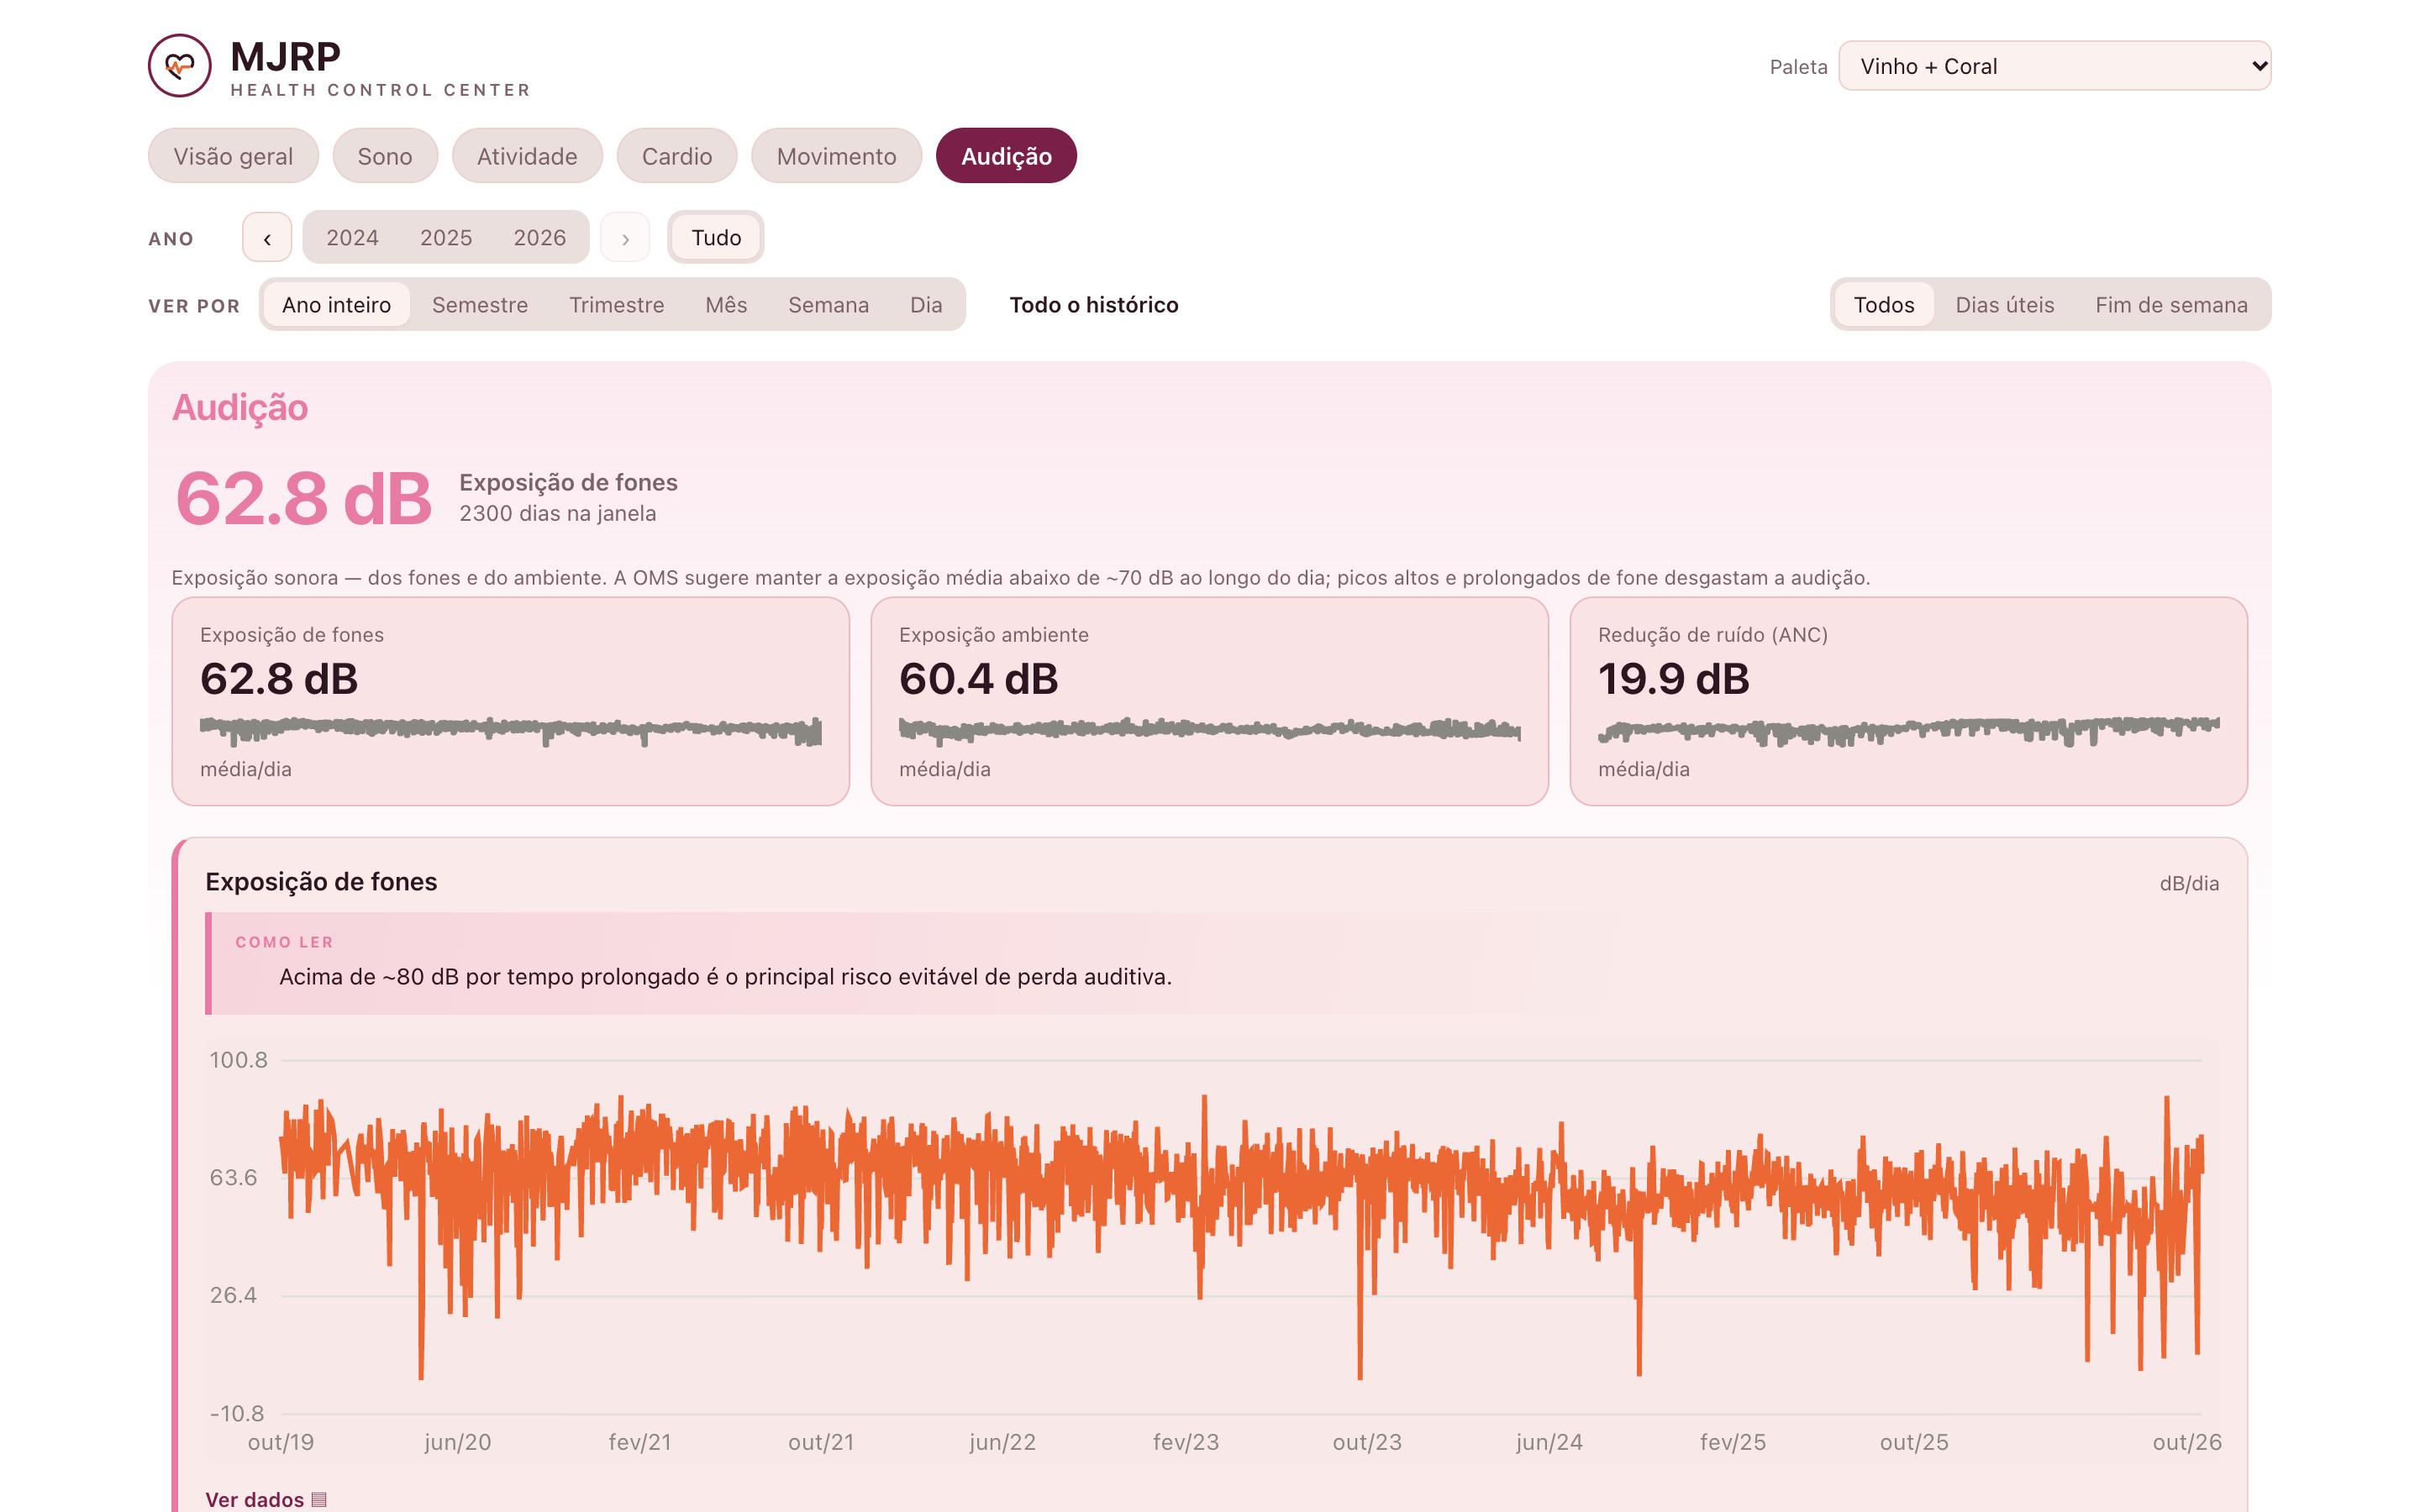
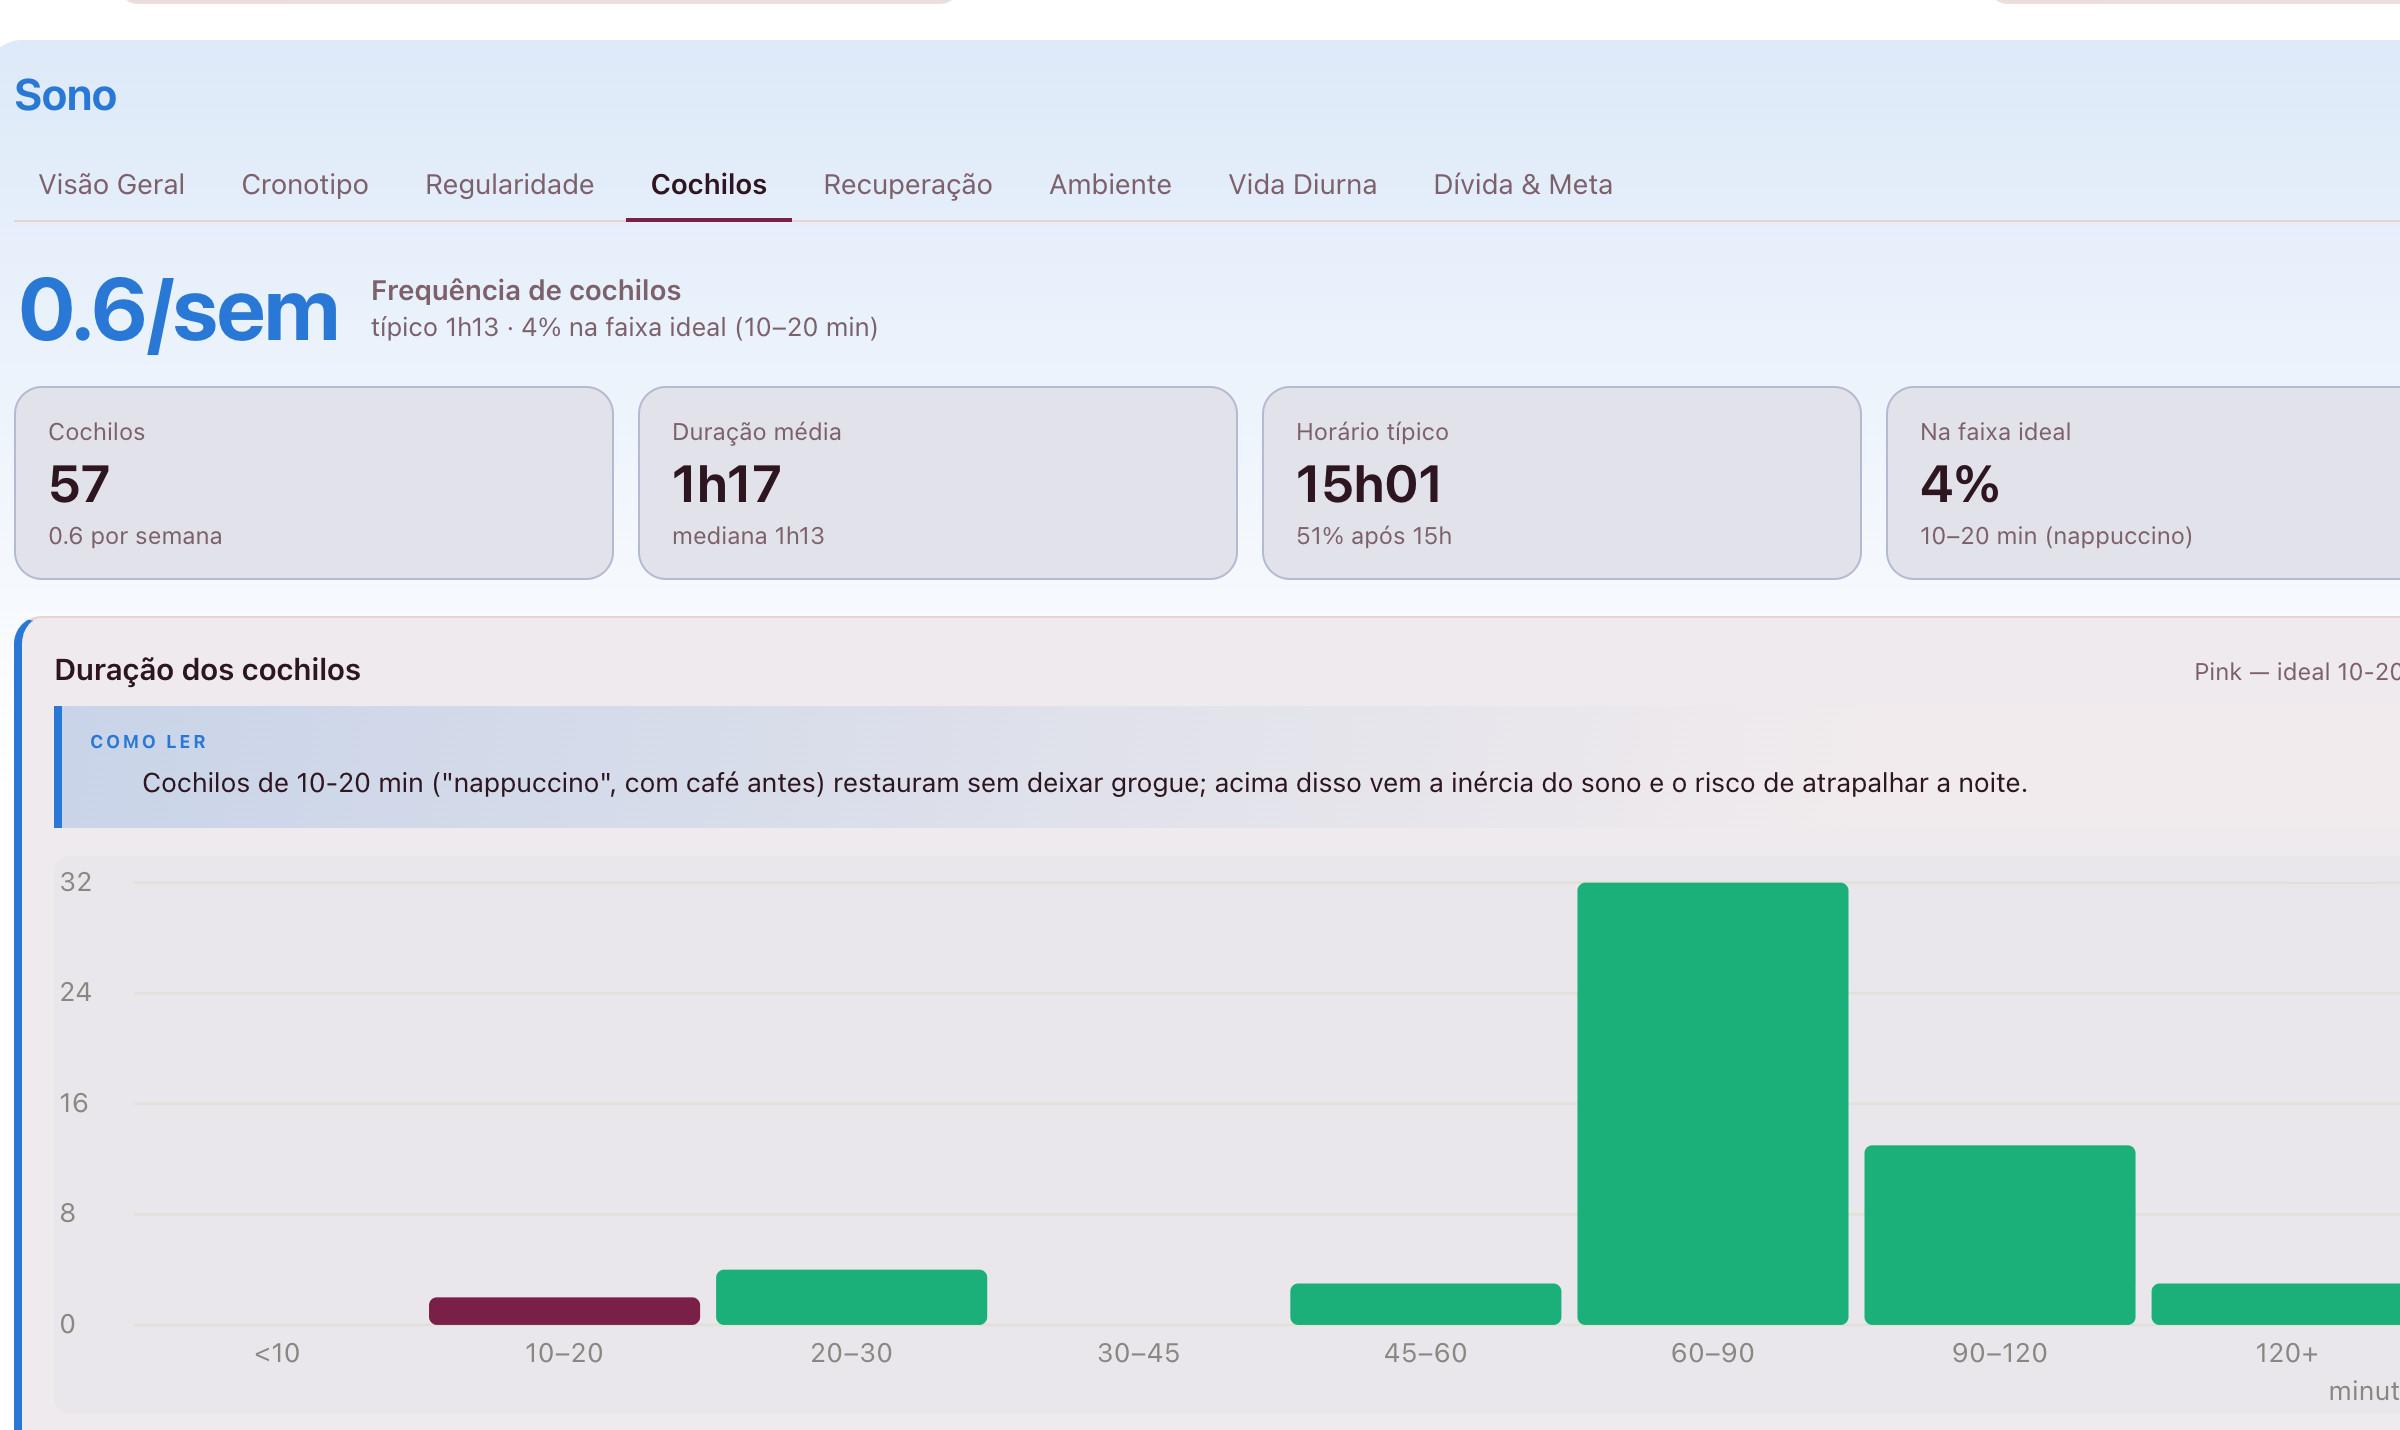
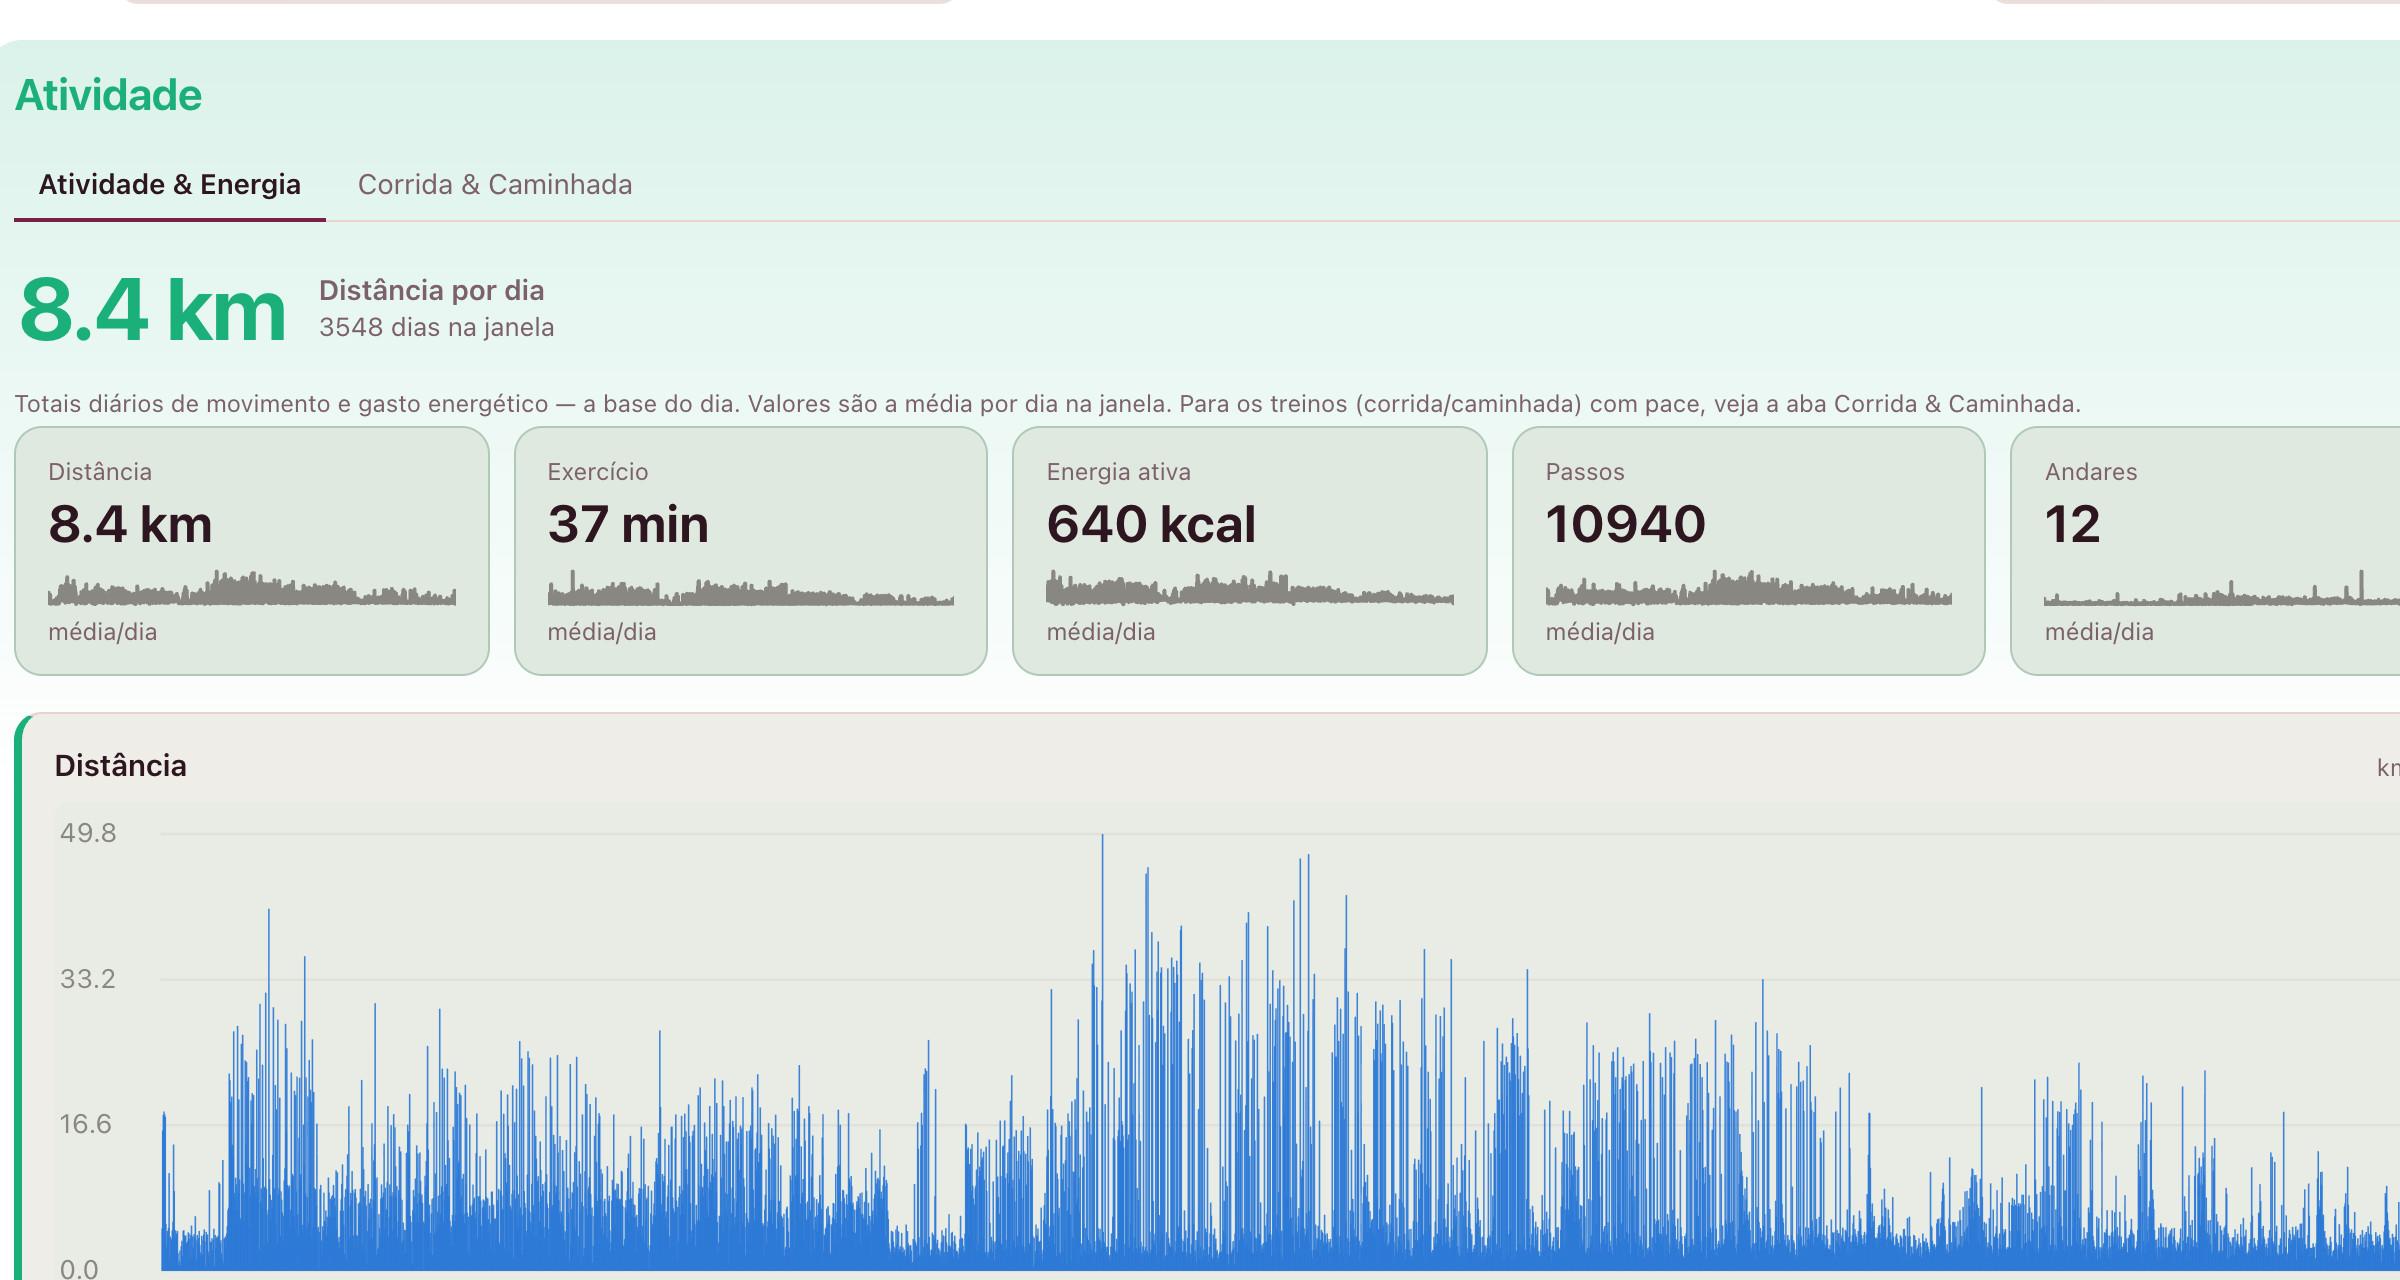
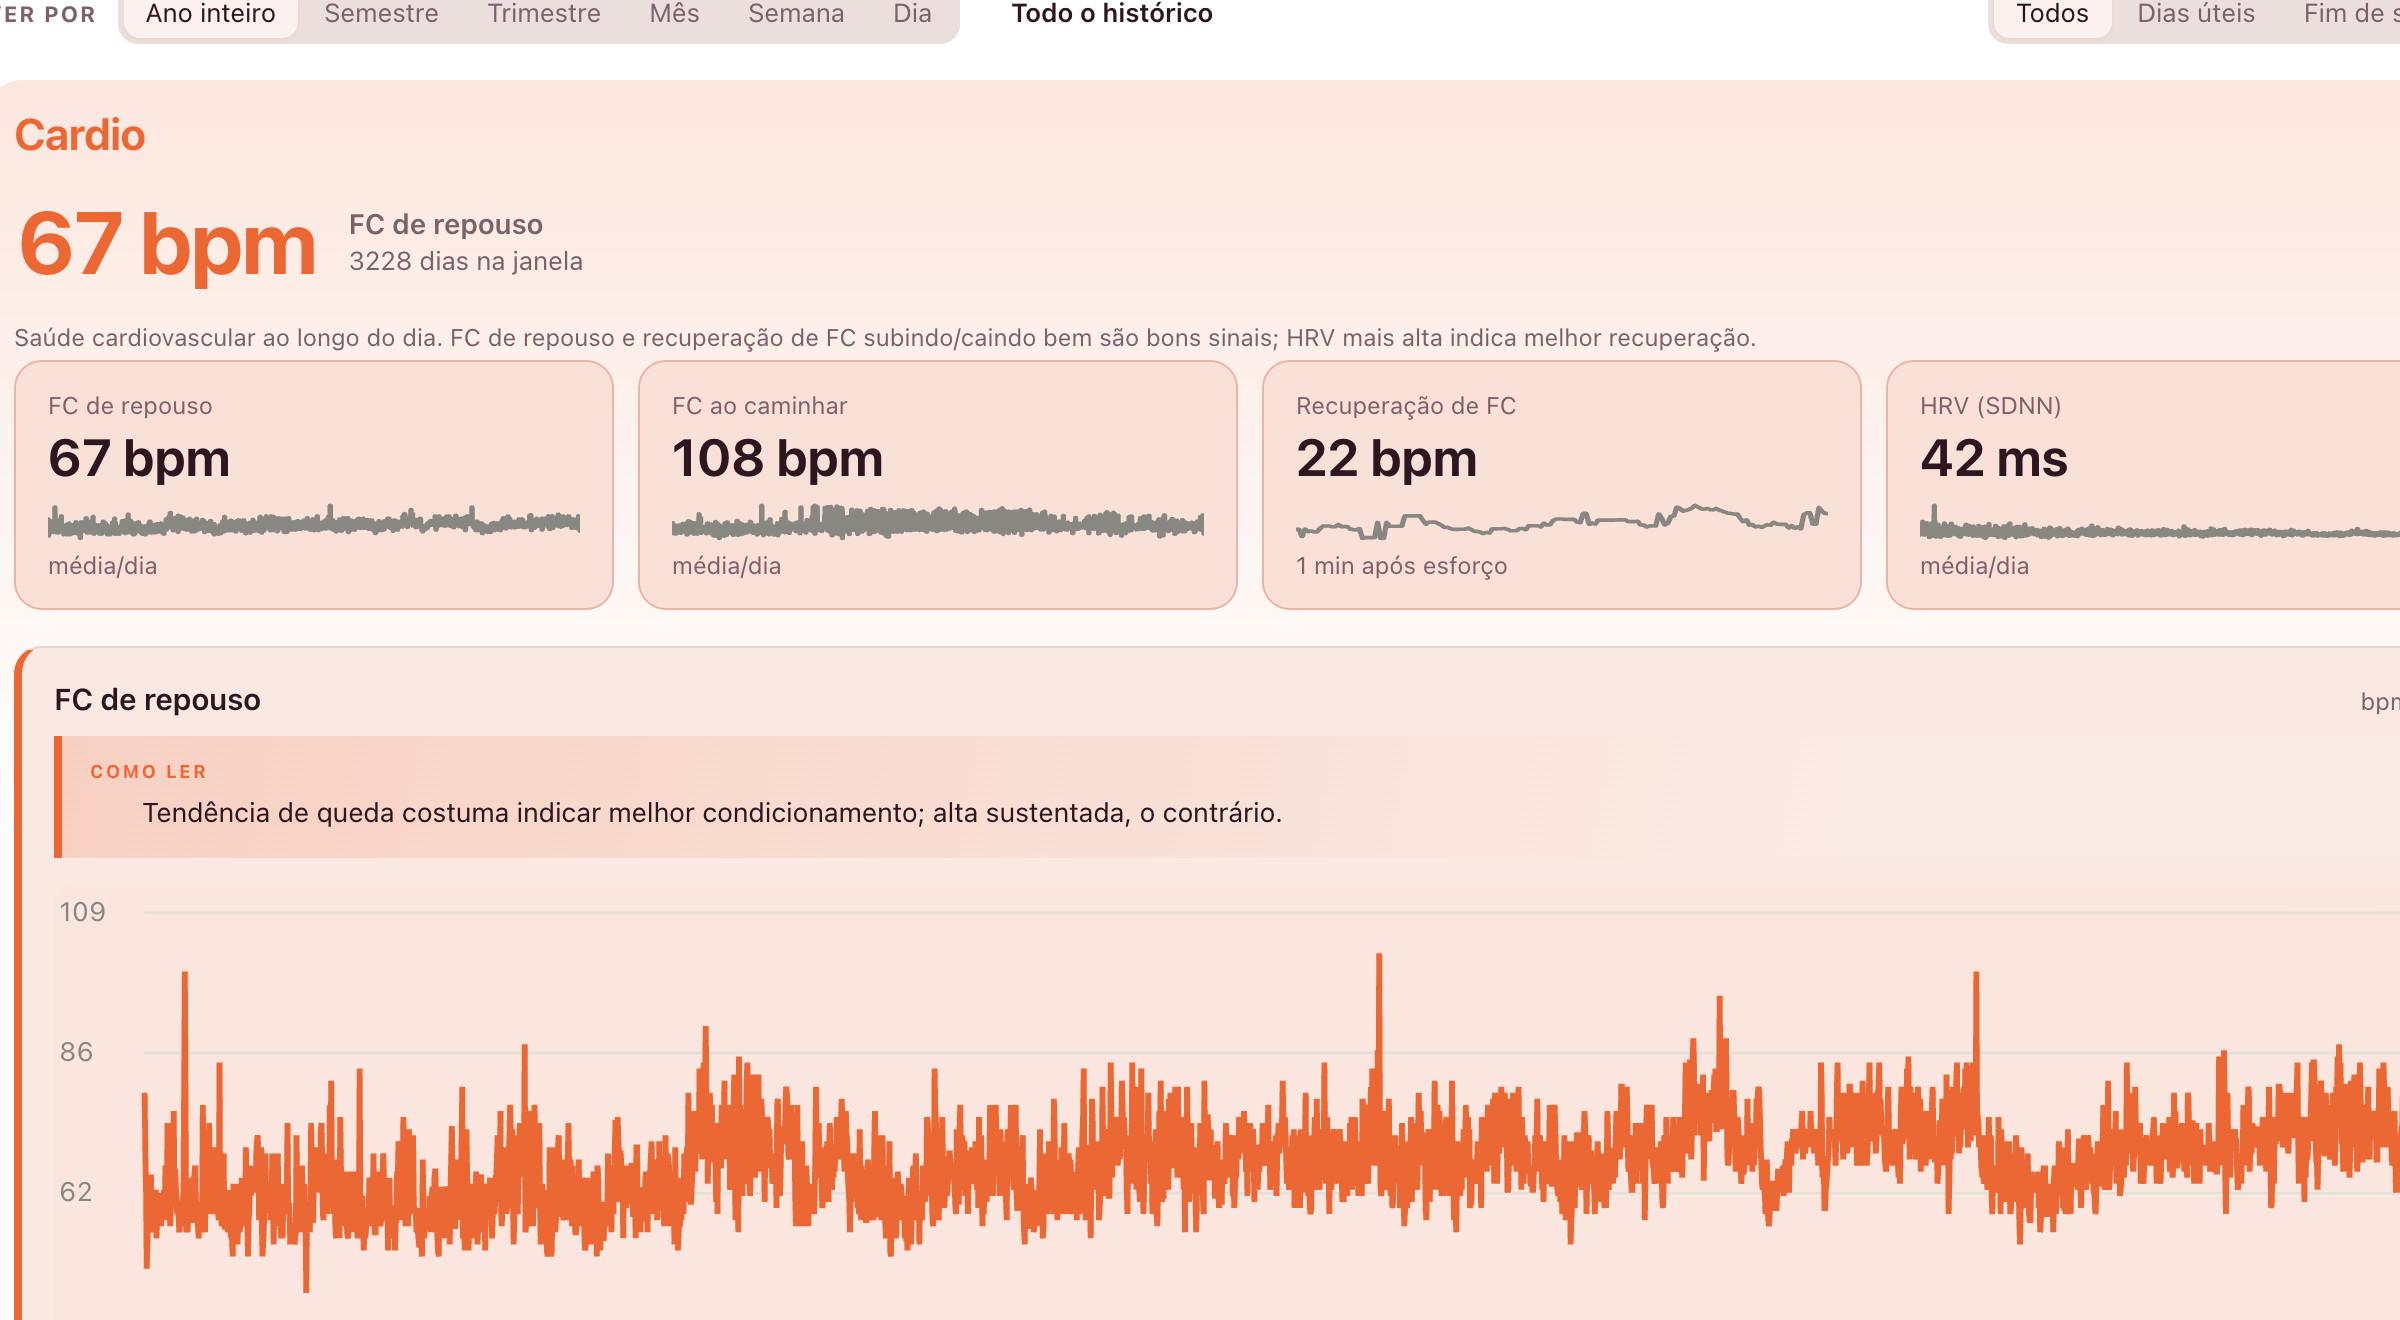
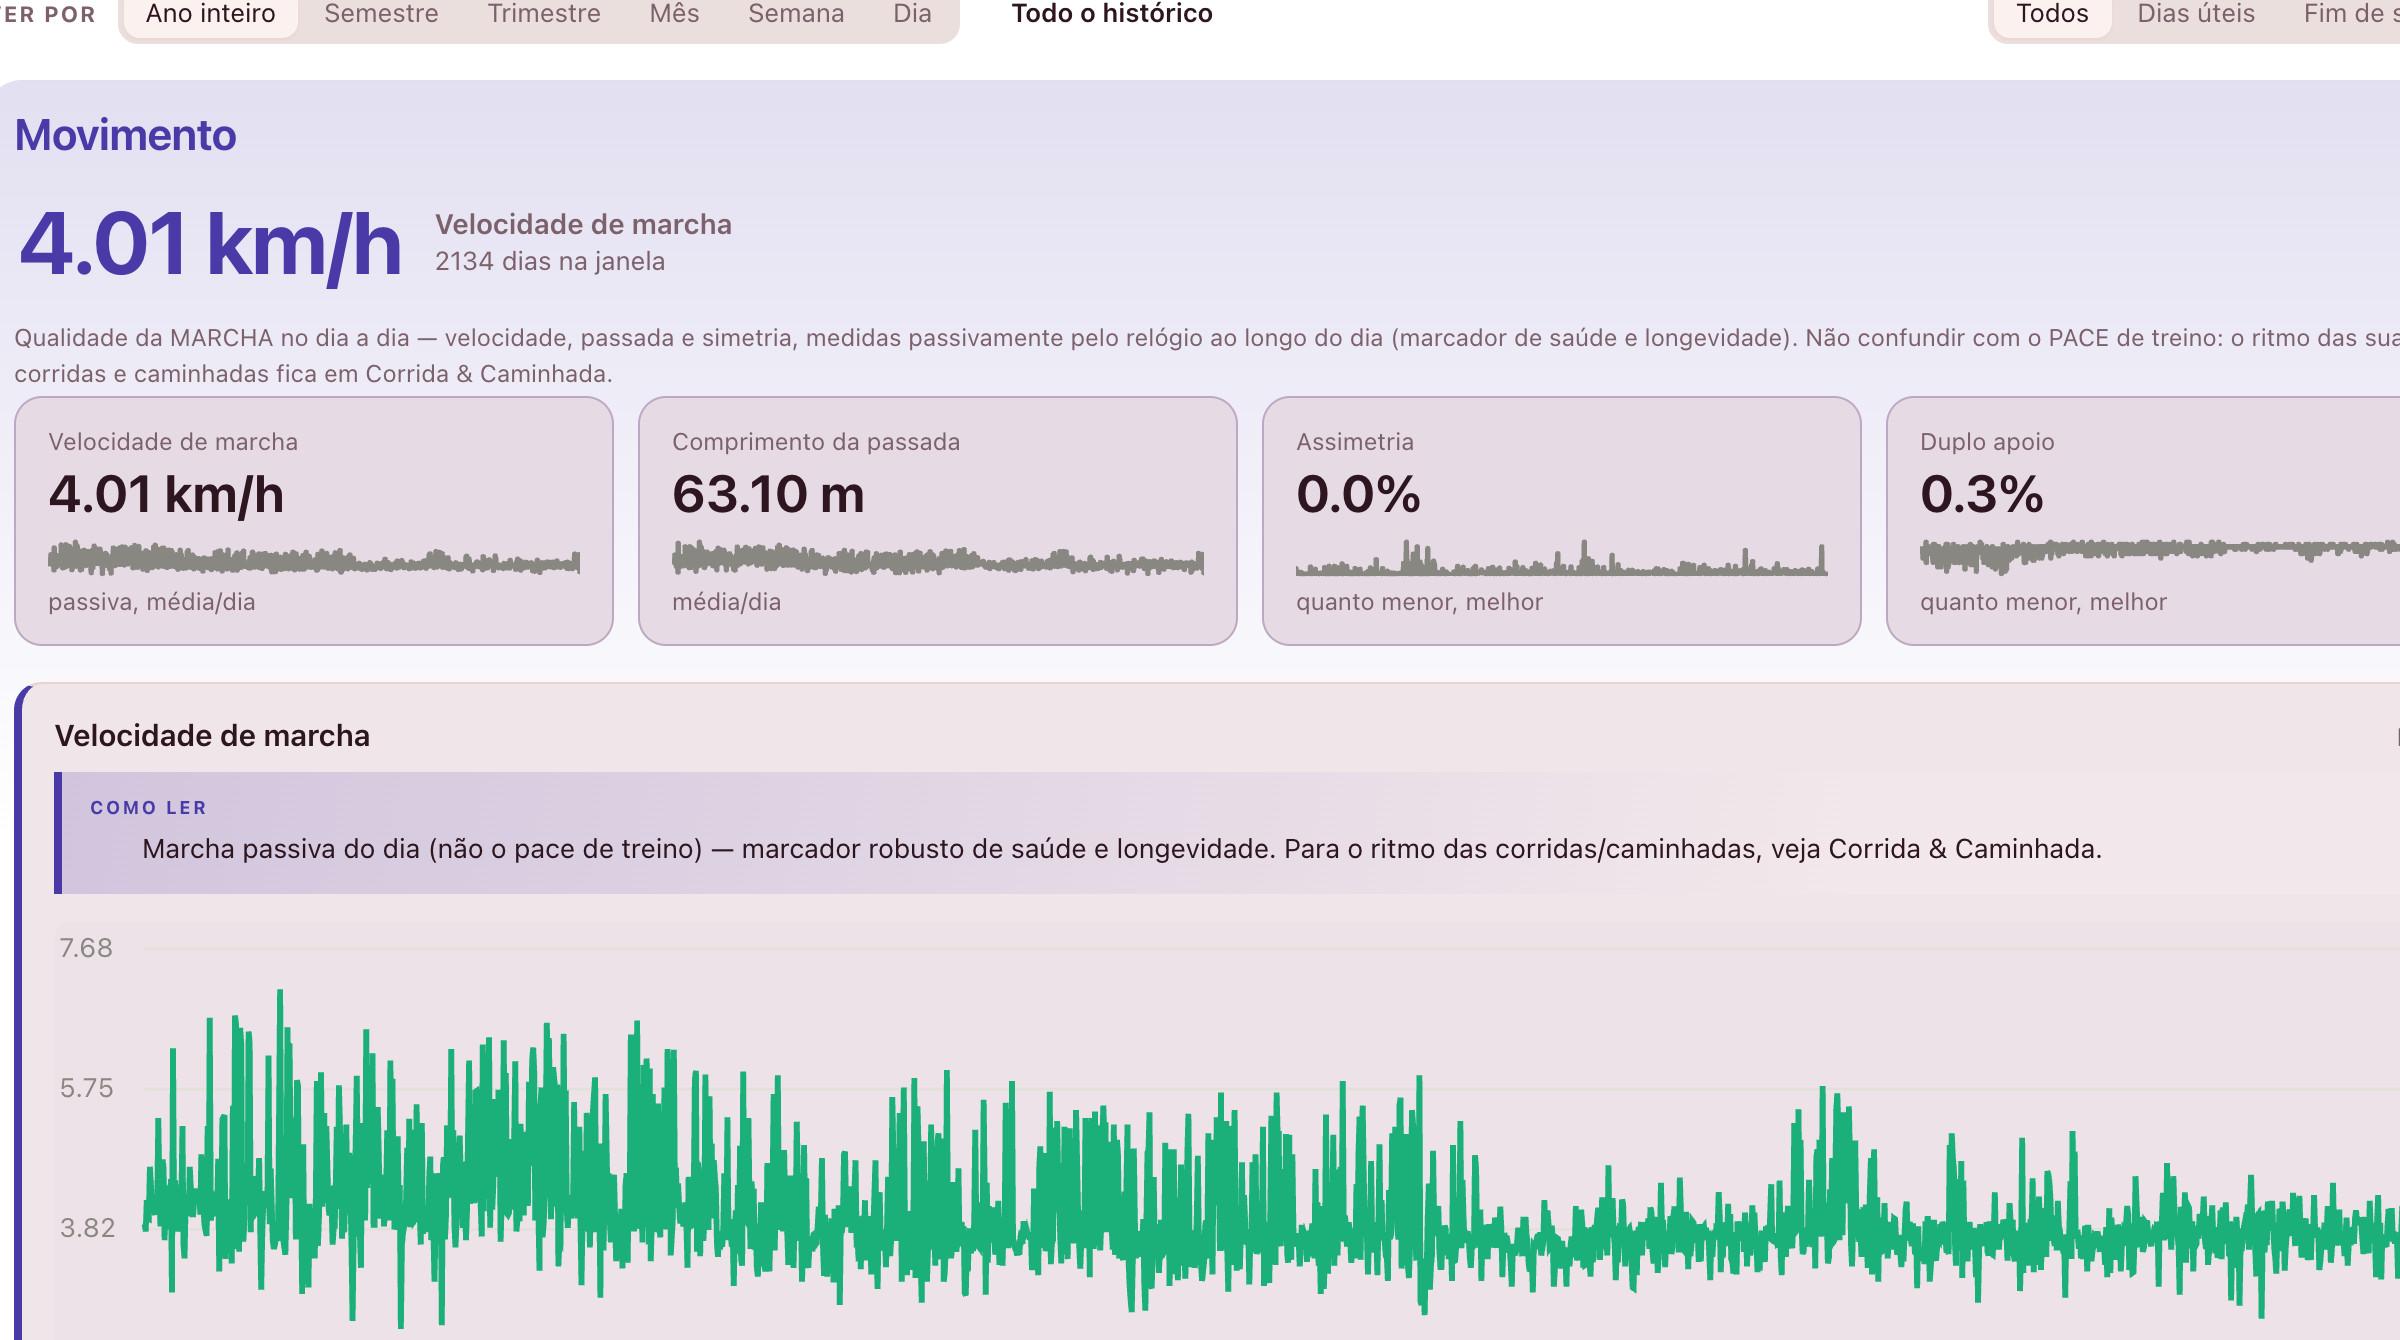
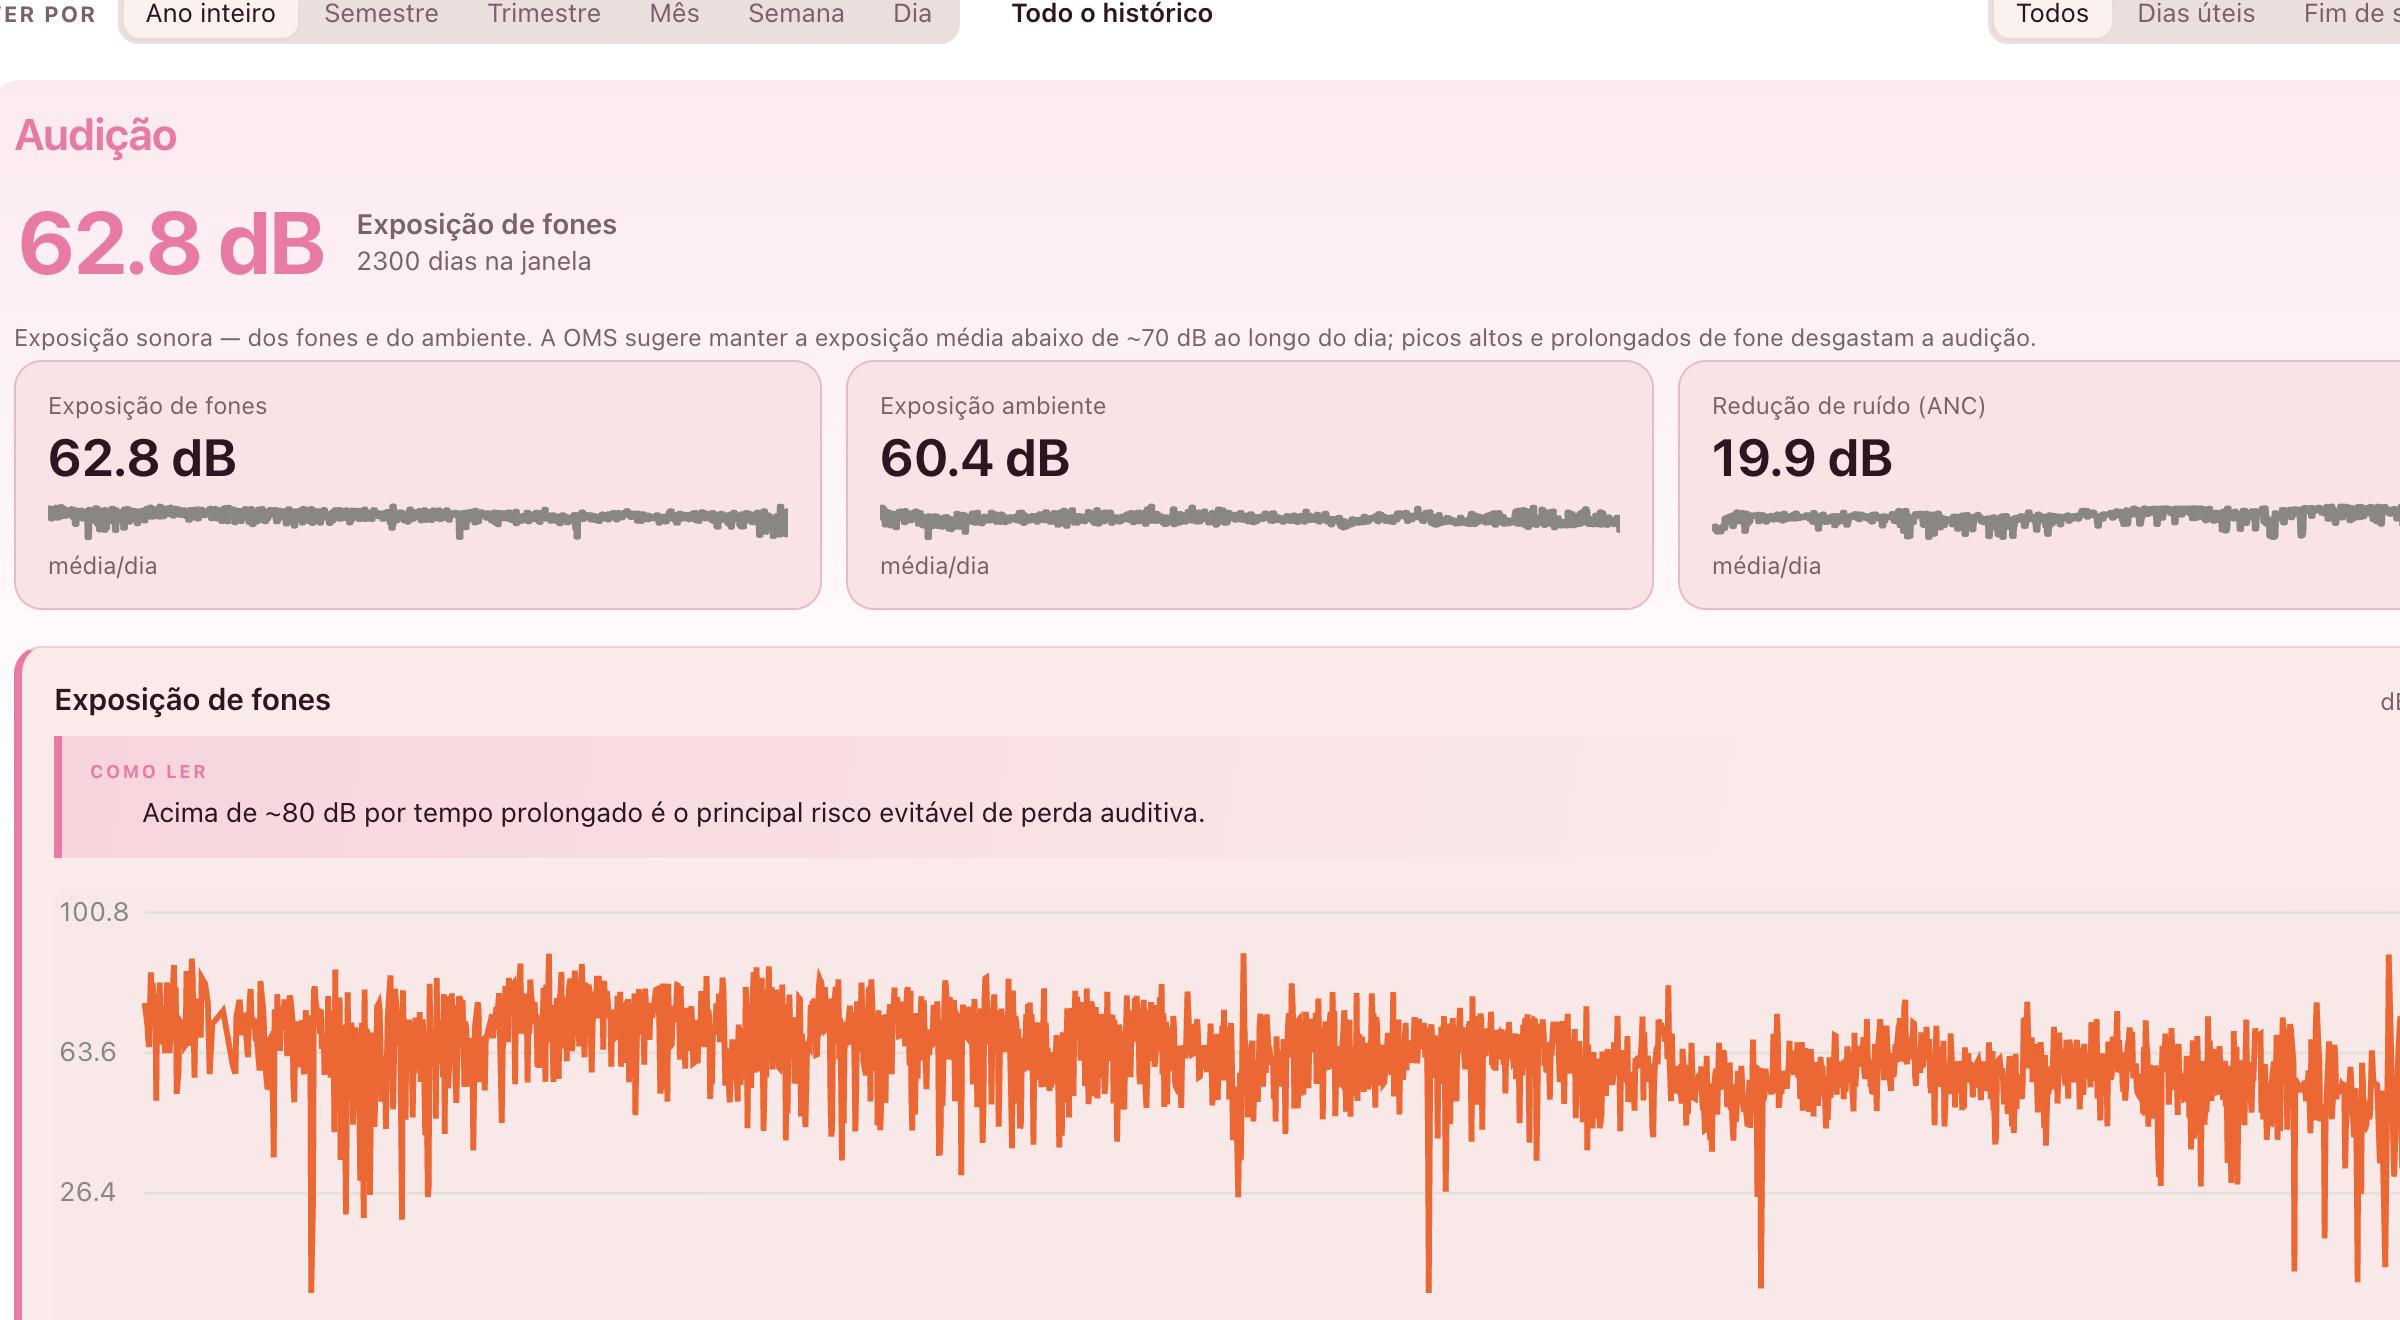
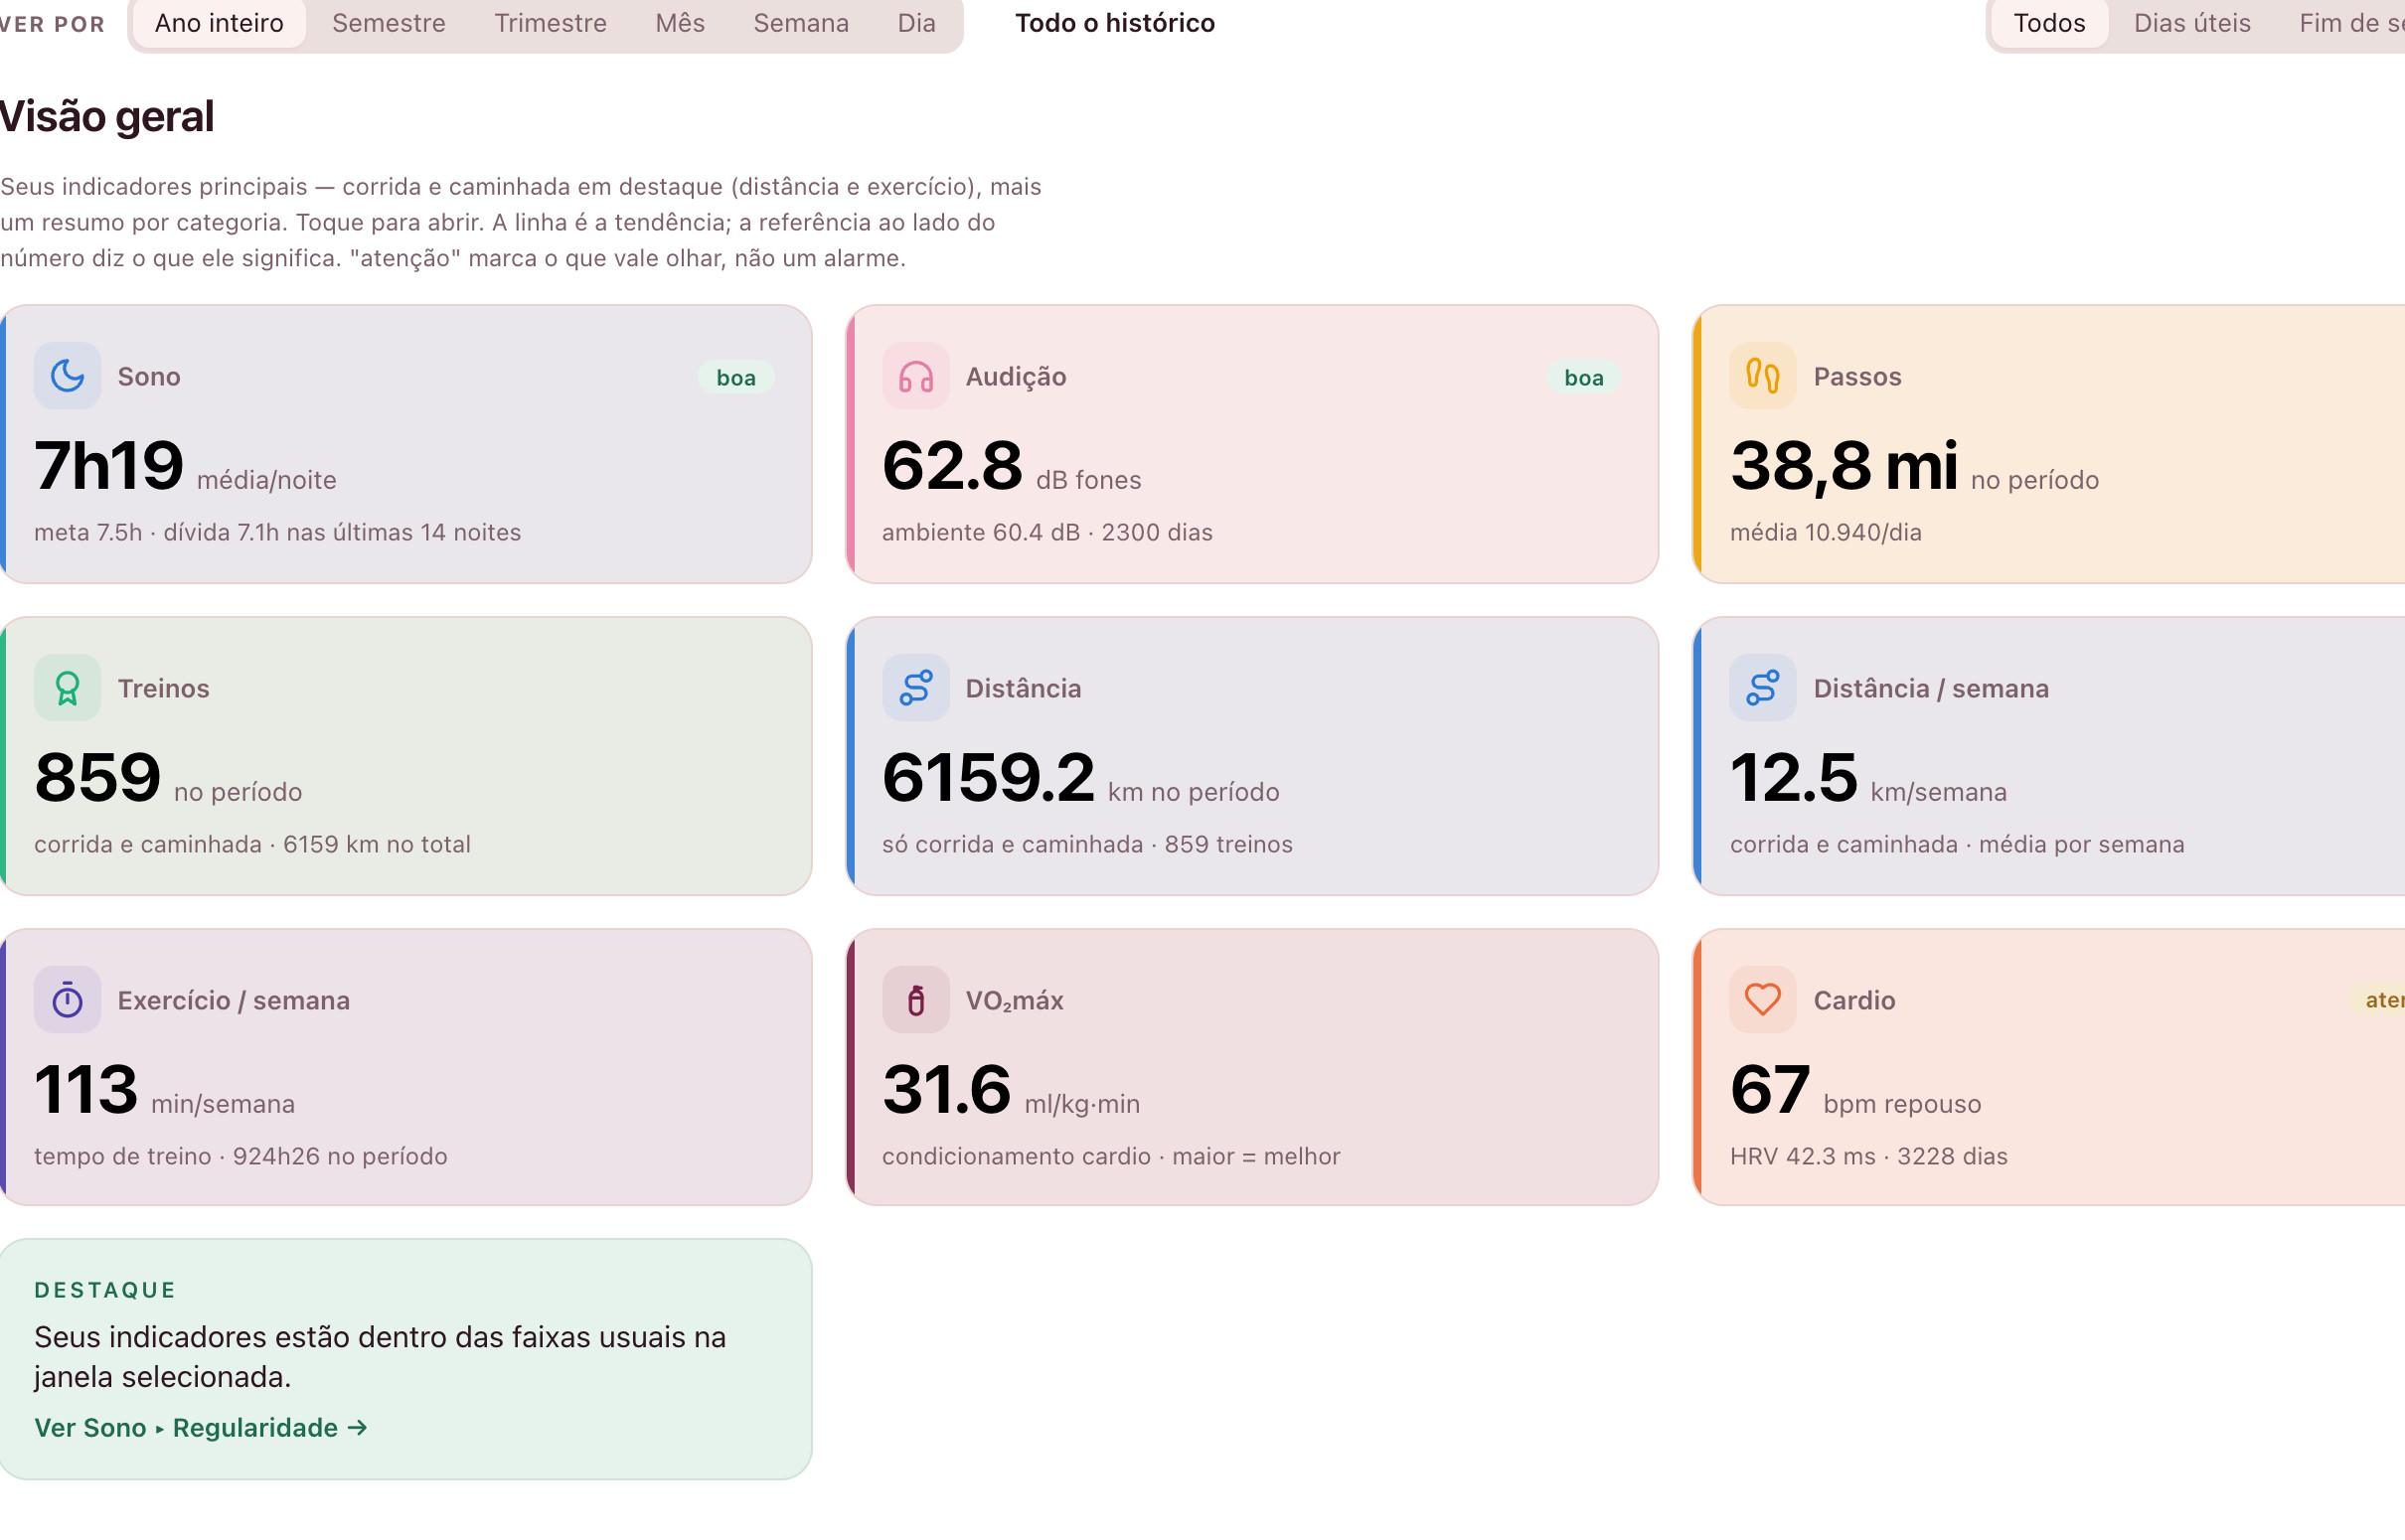
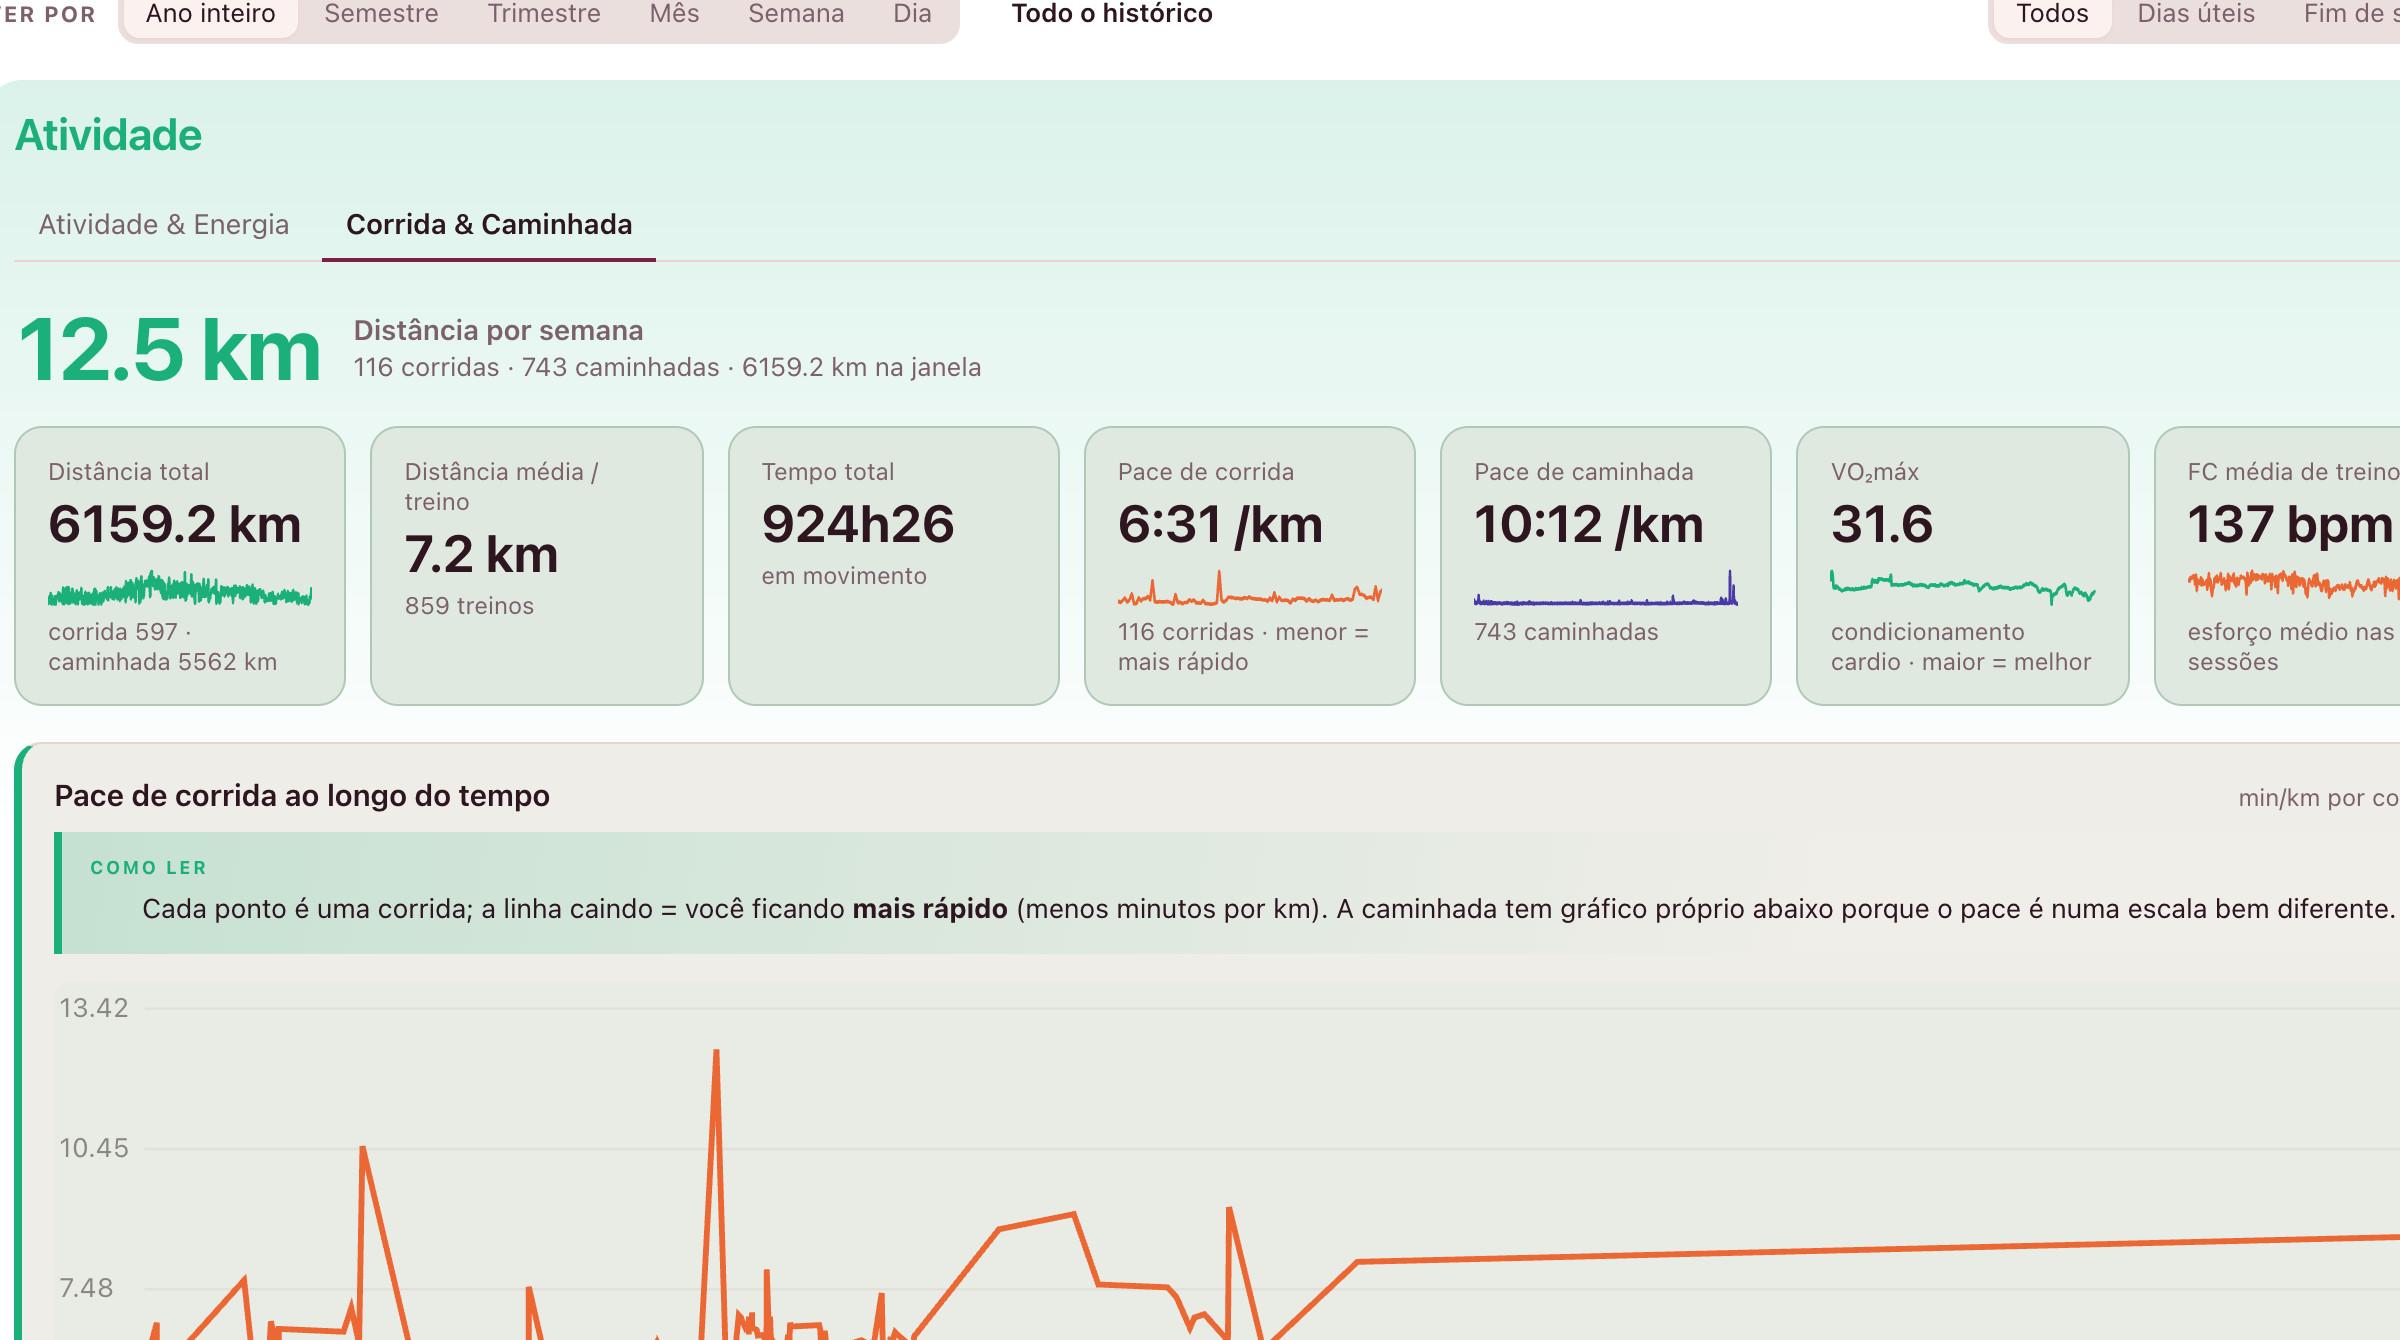
The opening dashboard: millions of records become a summary by area.
The problem
The export holds millions of records, and commercial apps send sensitive data to the cloud.
The opening dashboard: millions of records become a summary by area.
The solution
A Python program streams the file and feeds a React dashboard that runs only on my computer.
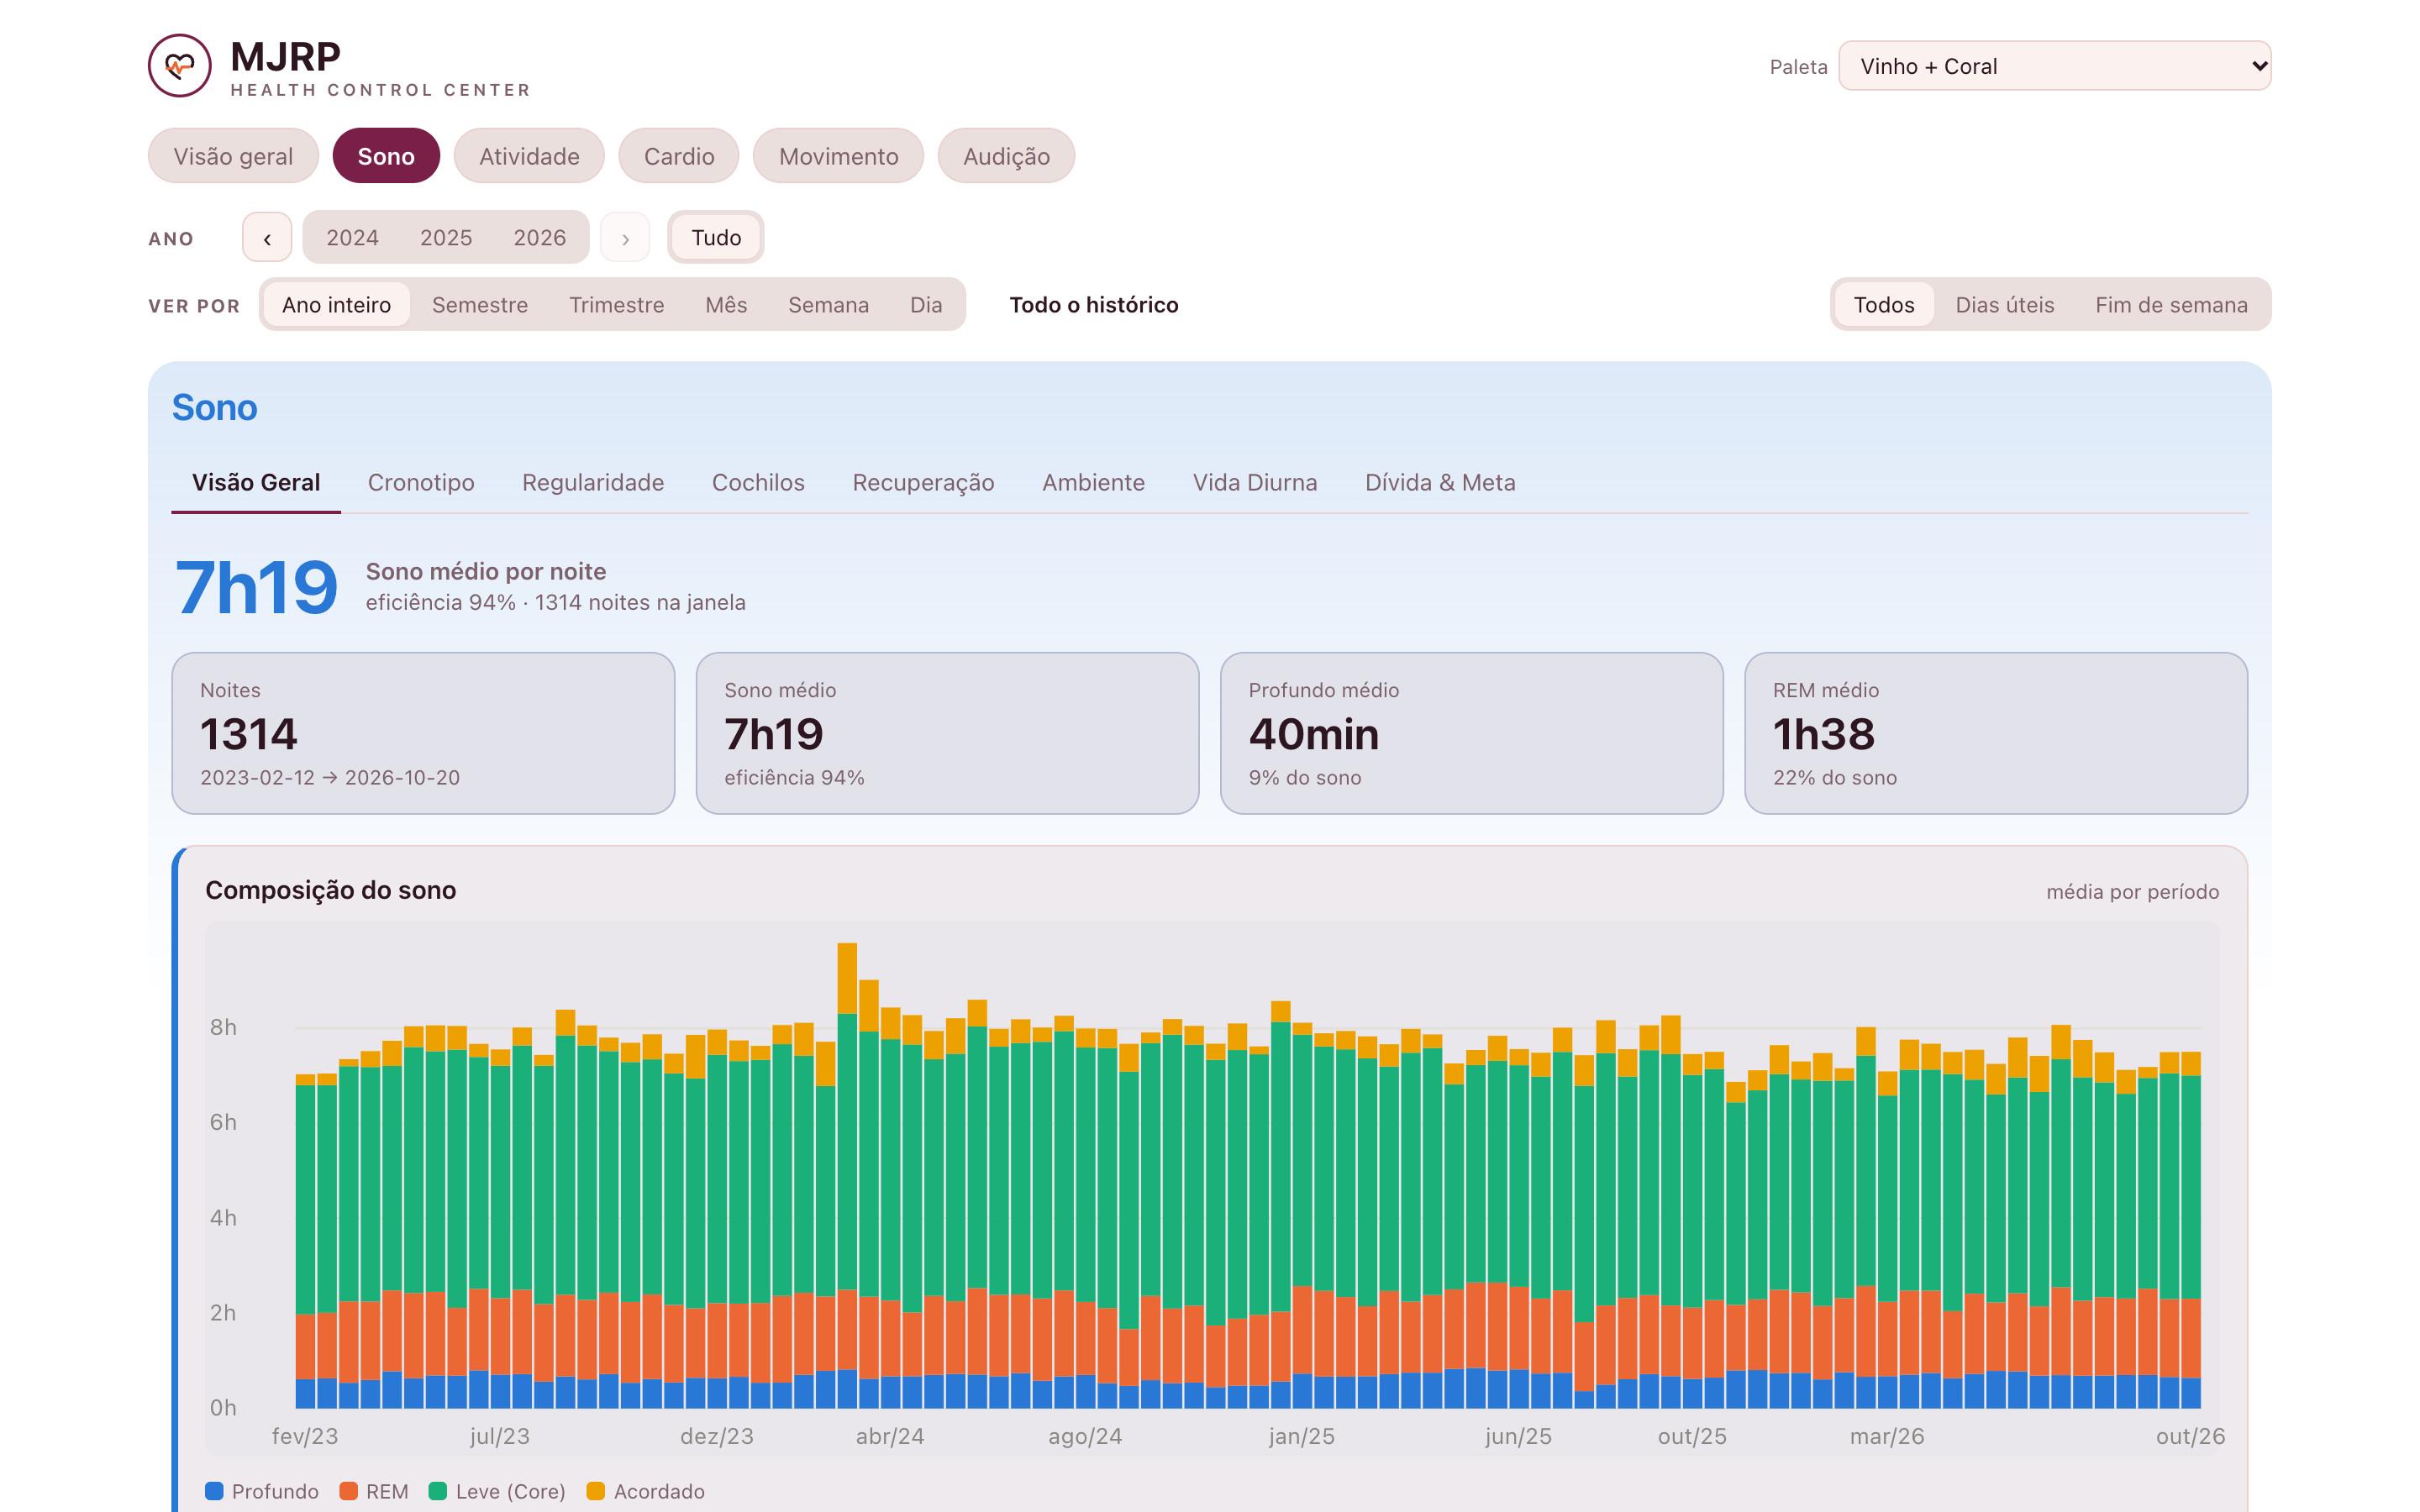
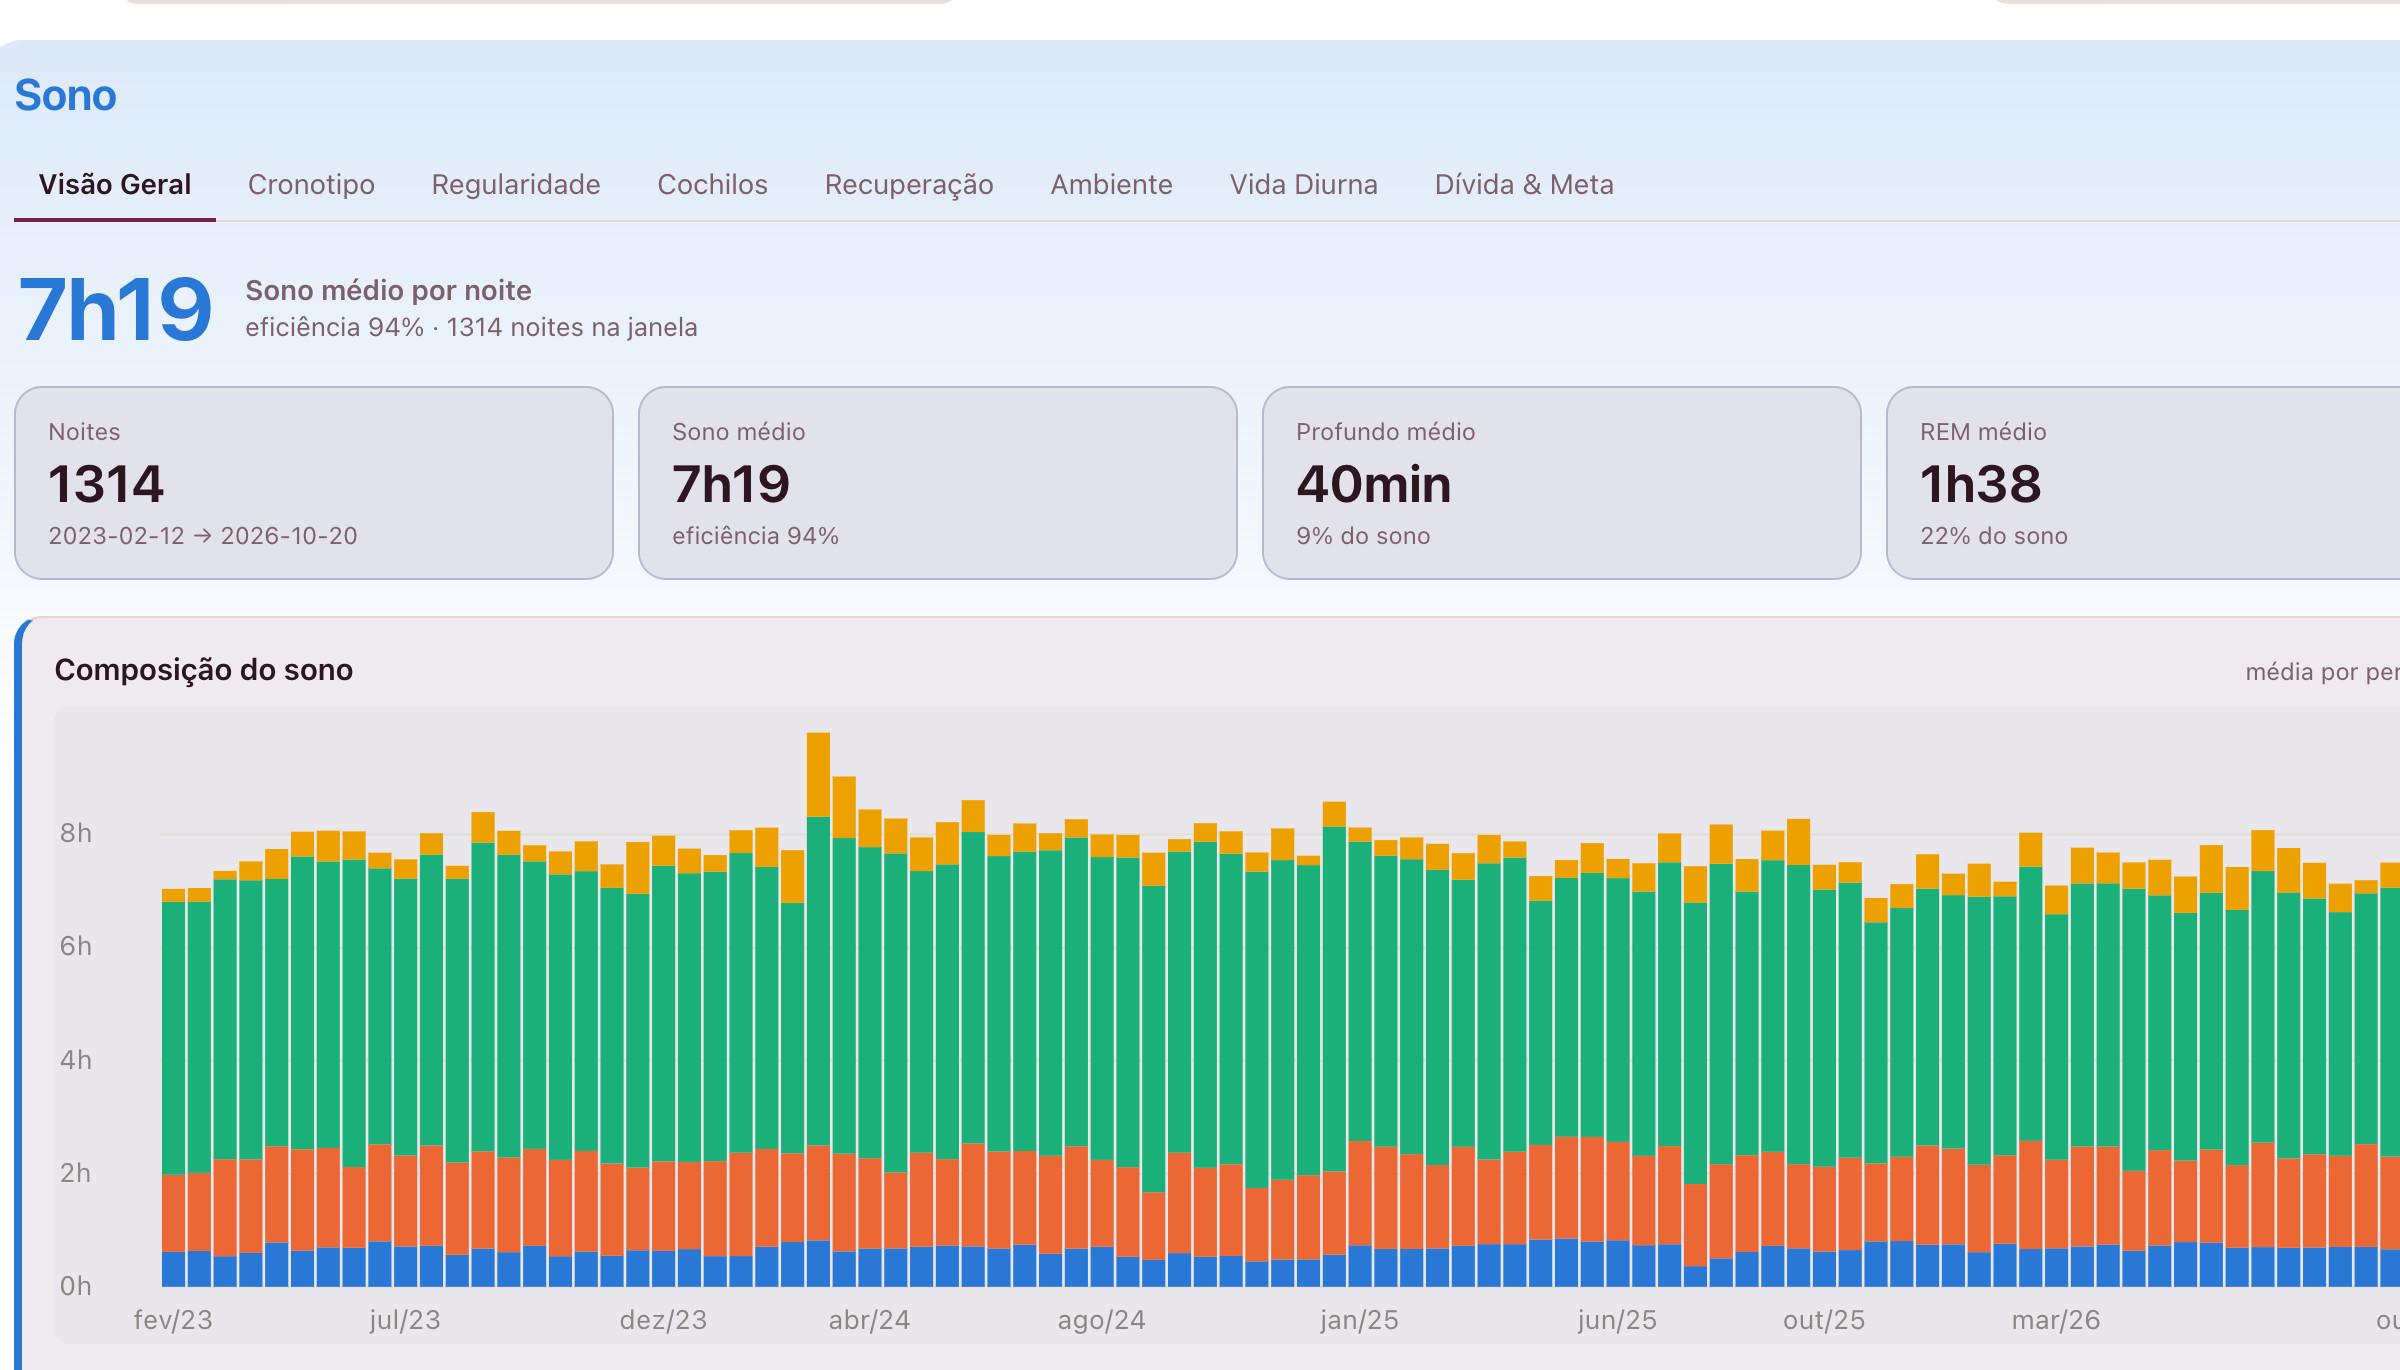
Sleep: 1,314 nights, with the composition of each period.
Beyond the average
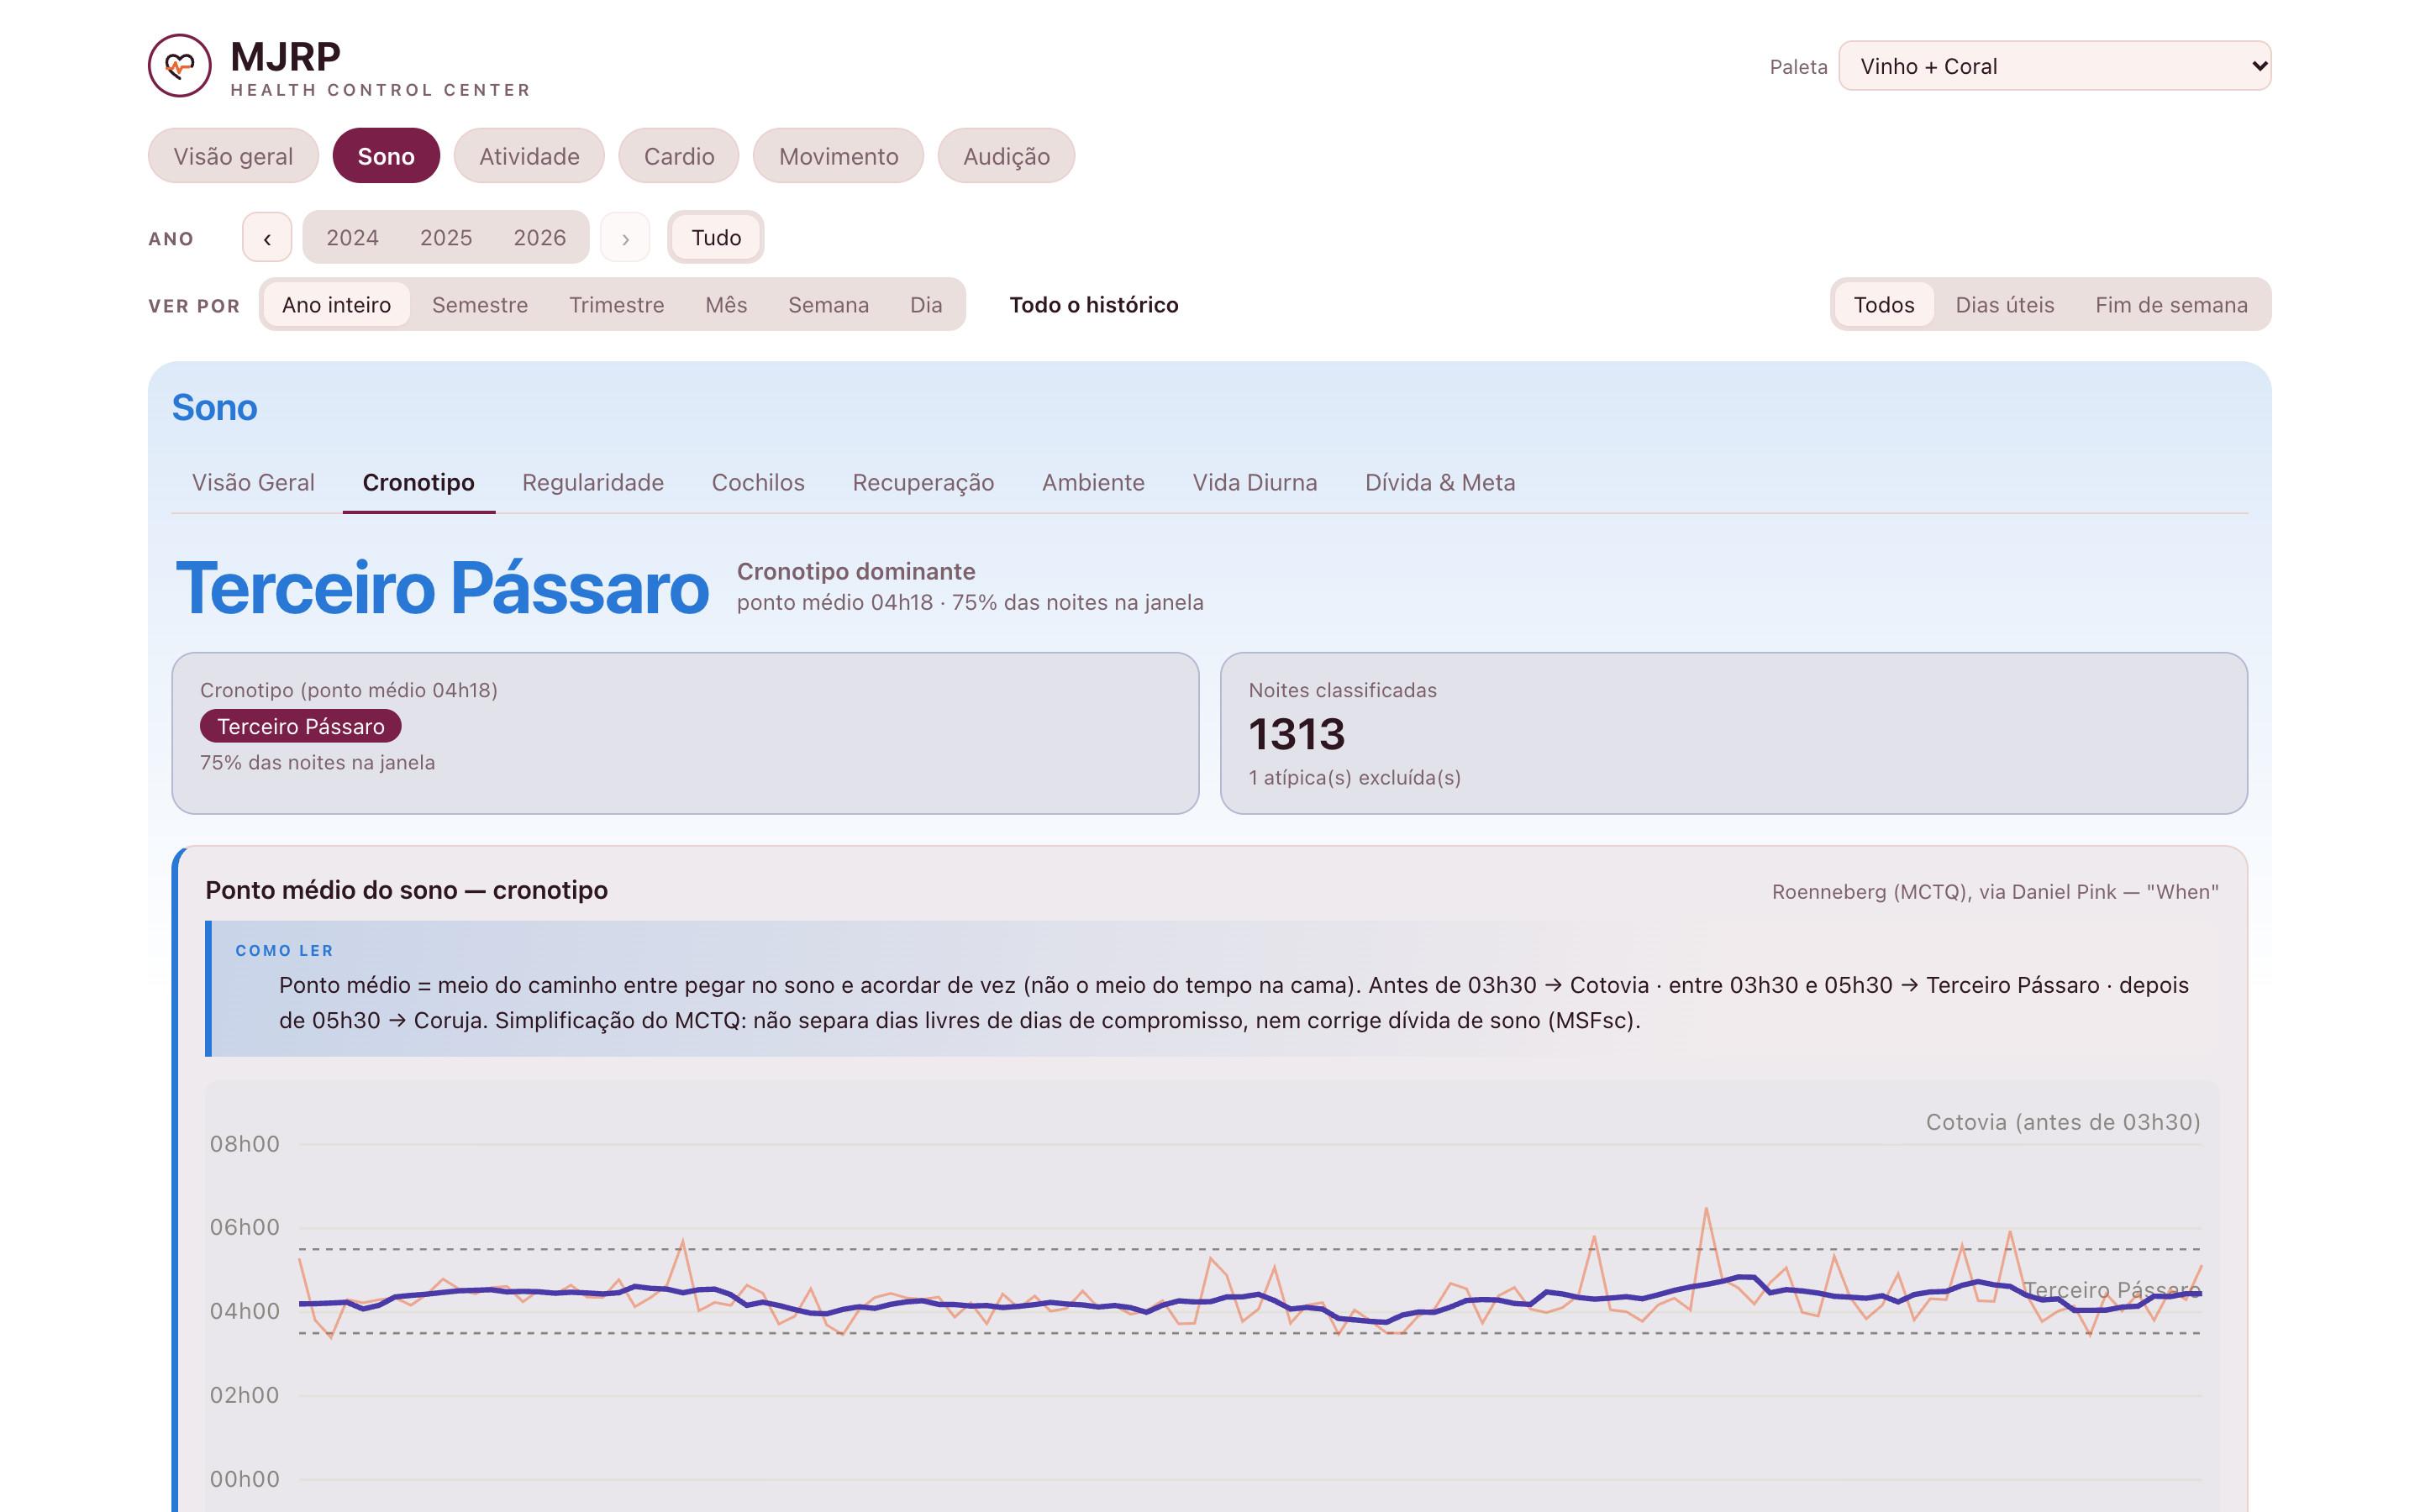
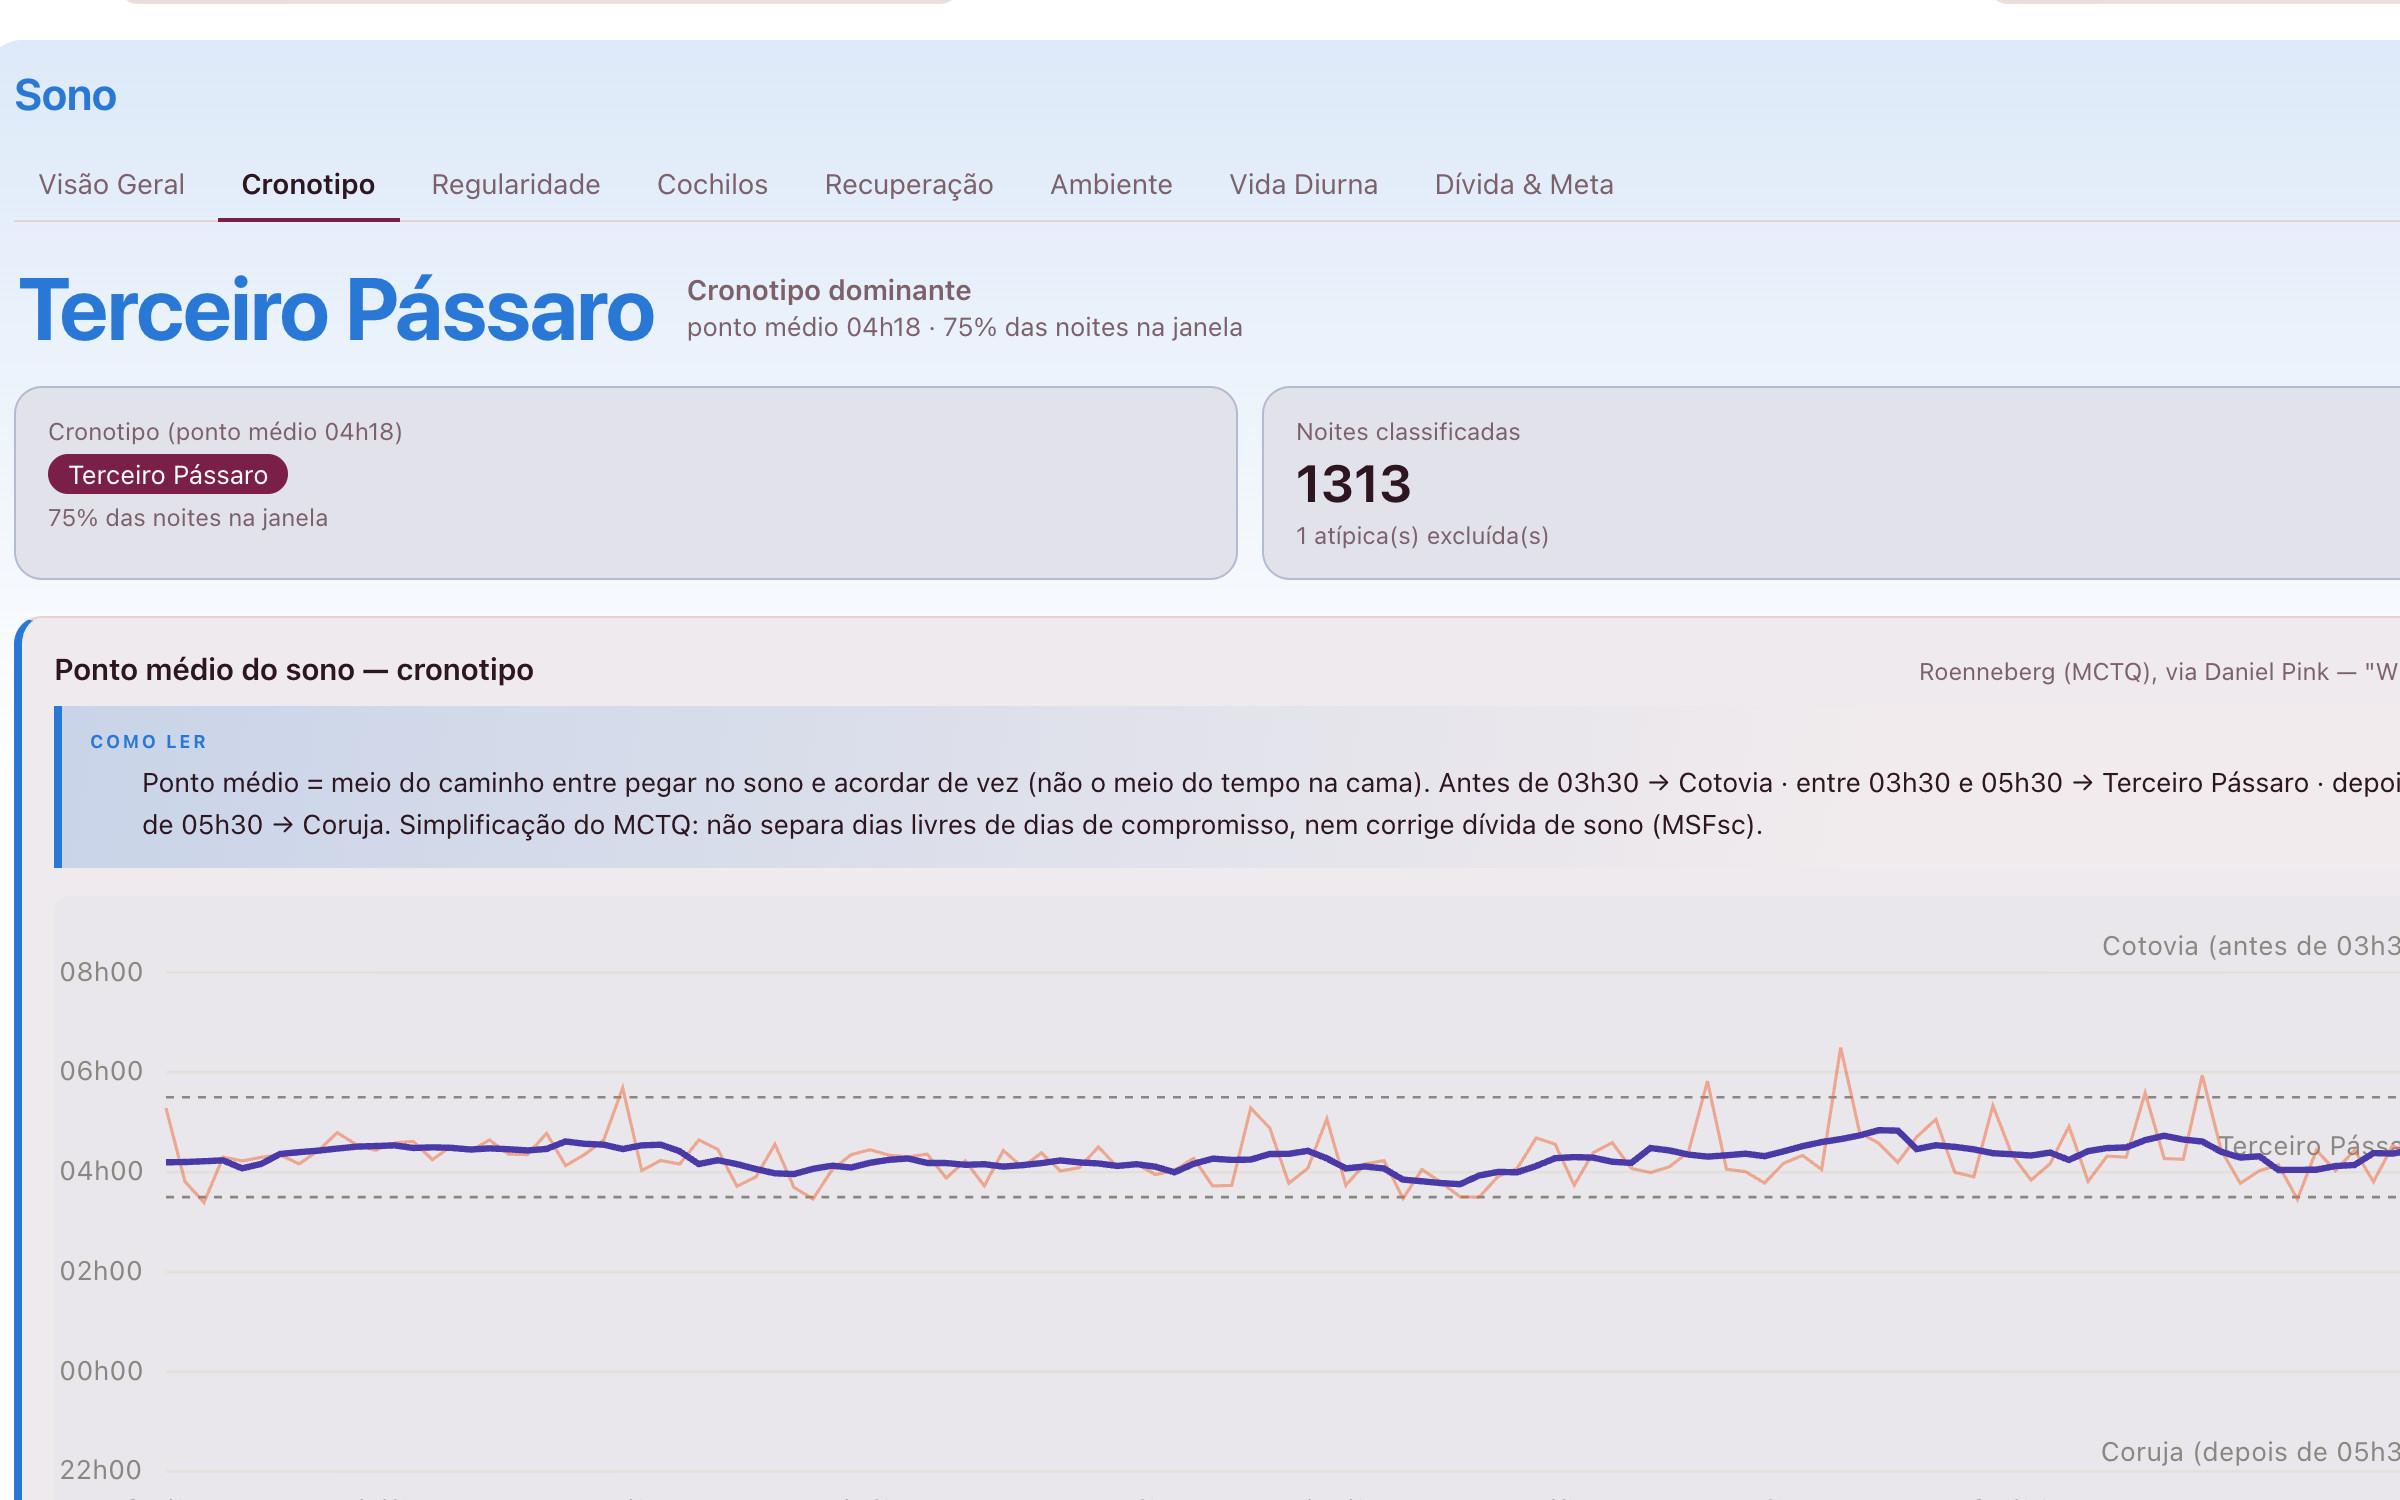
The dashboard doesn't stop at the average: it calculates each night's midpoint and shows the dominant chronotype.
The chronotype: the sleep midpoint, night by night, and how to read the chart.
The outcome
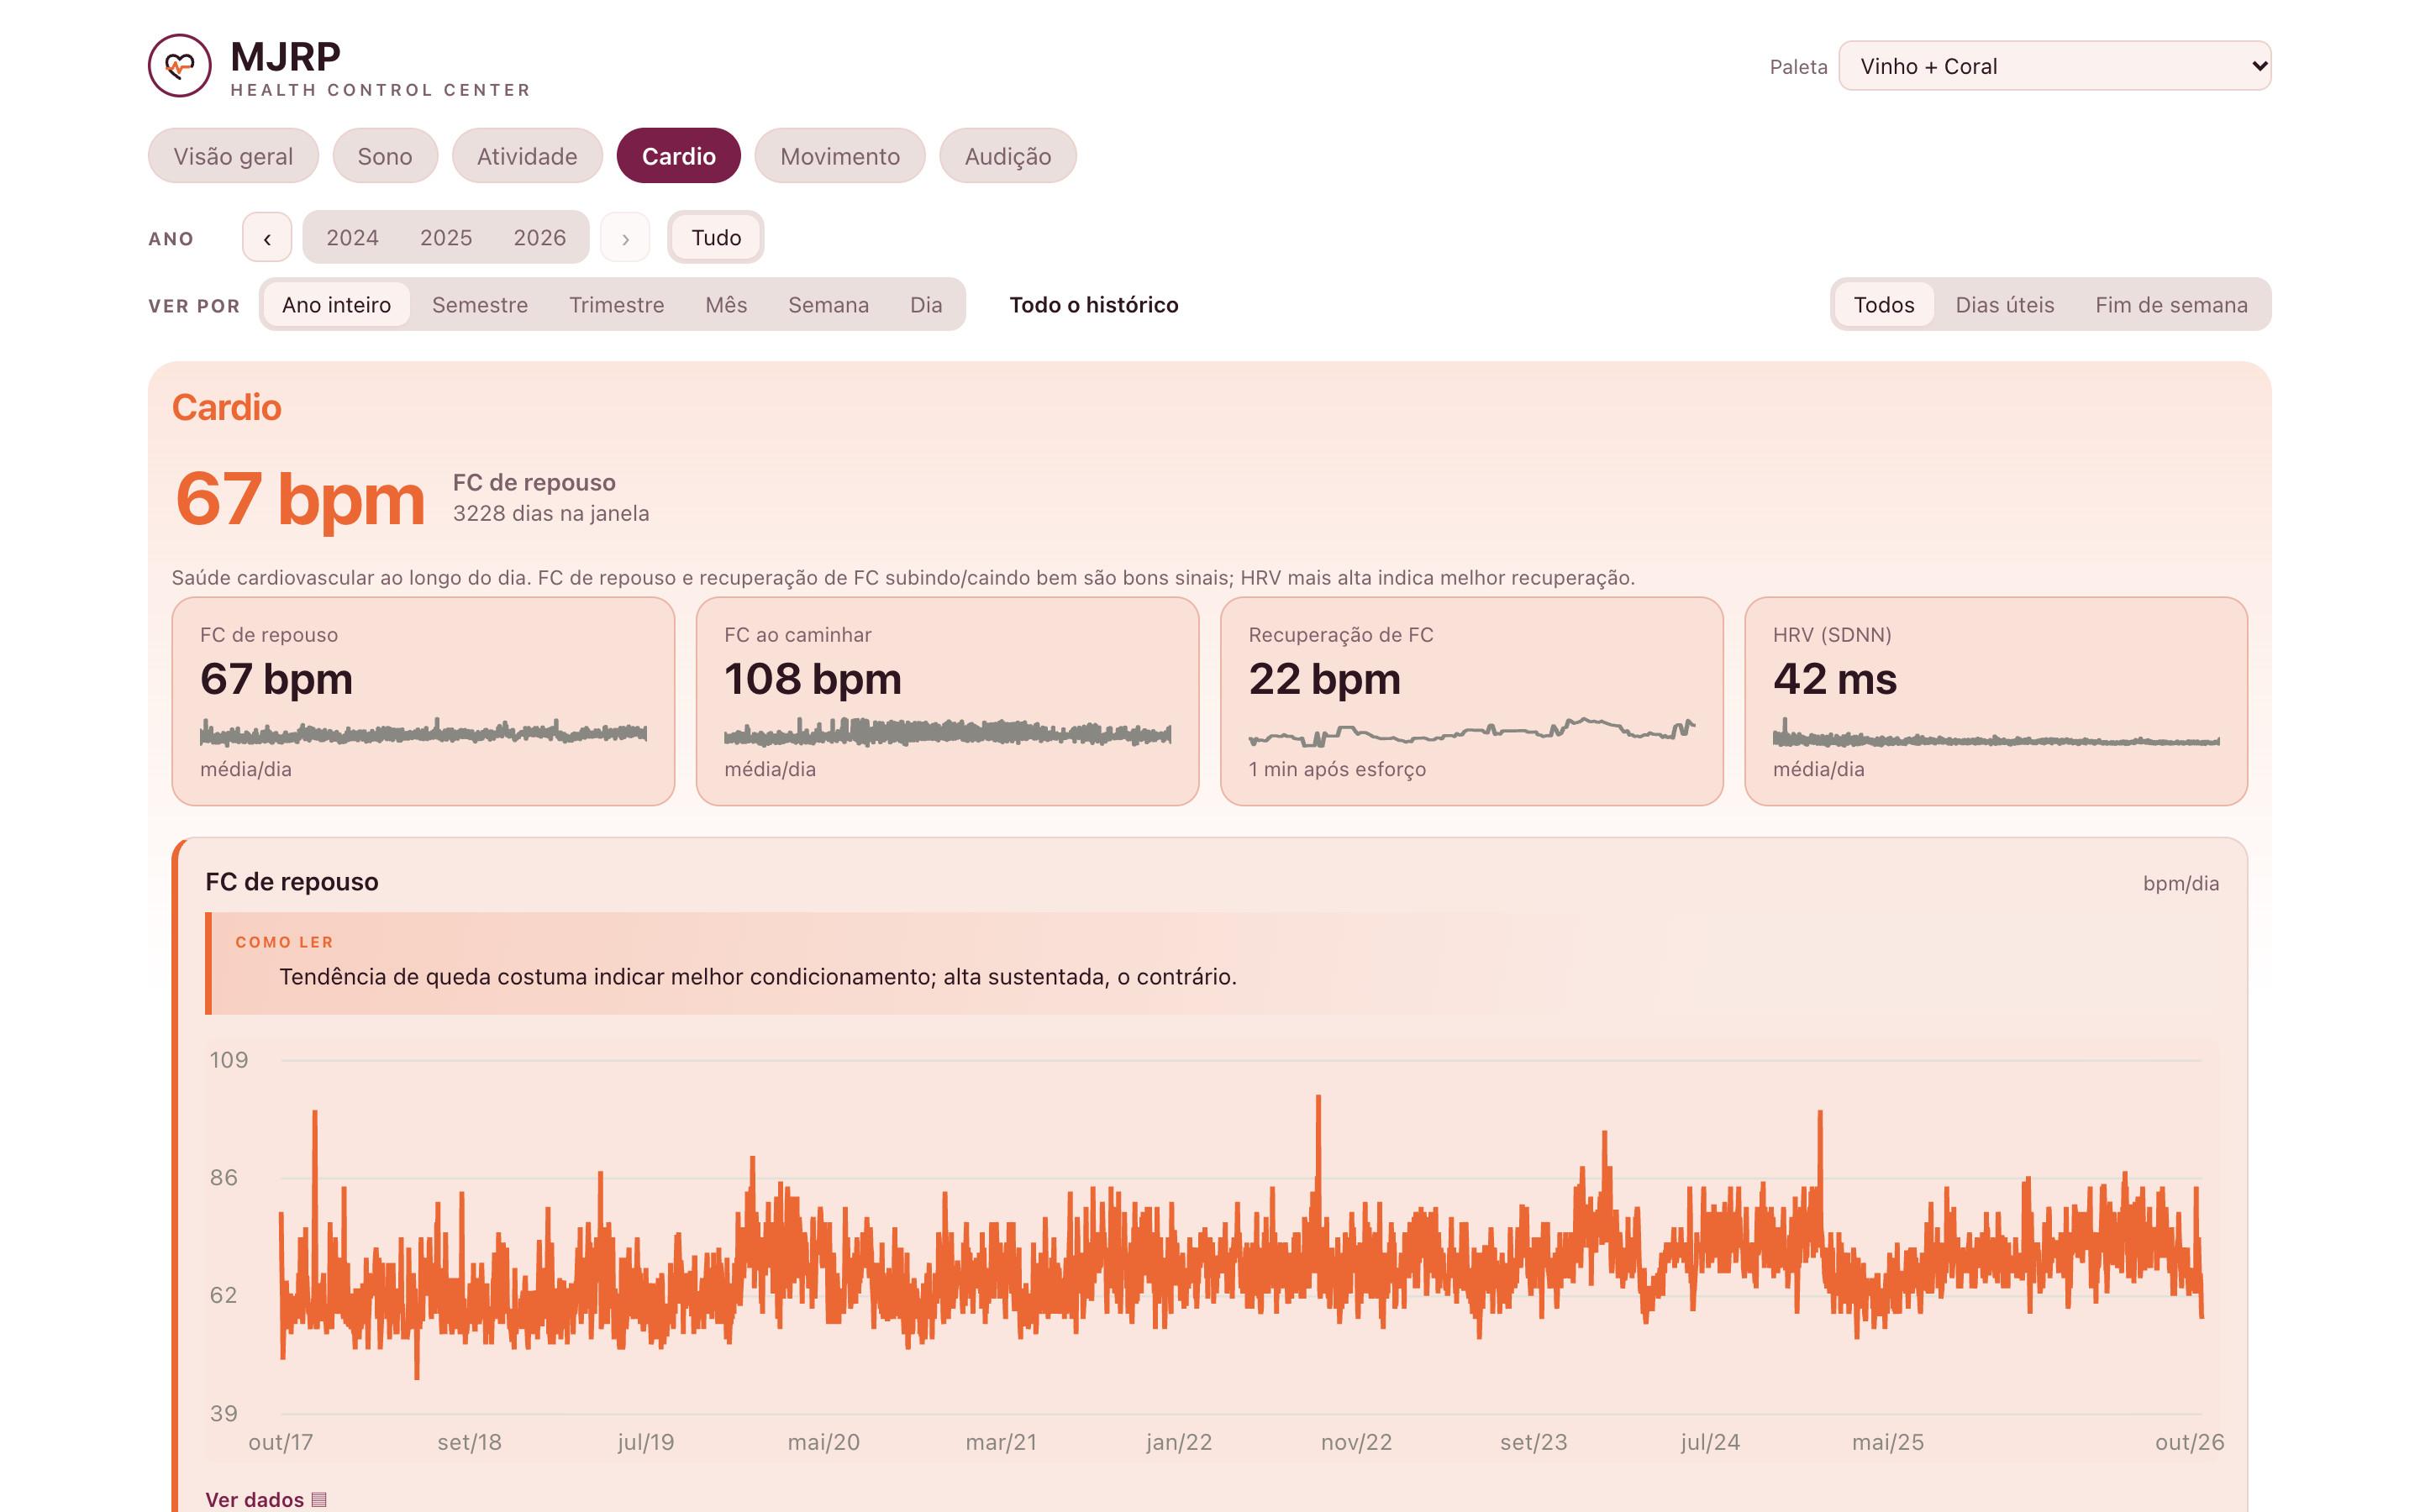
A long-term view of sleep, workouts and VO2 max, with no data sent to the cloud.
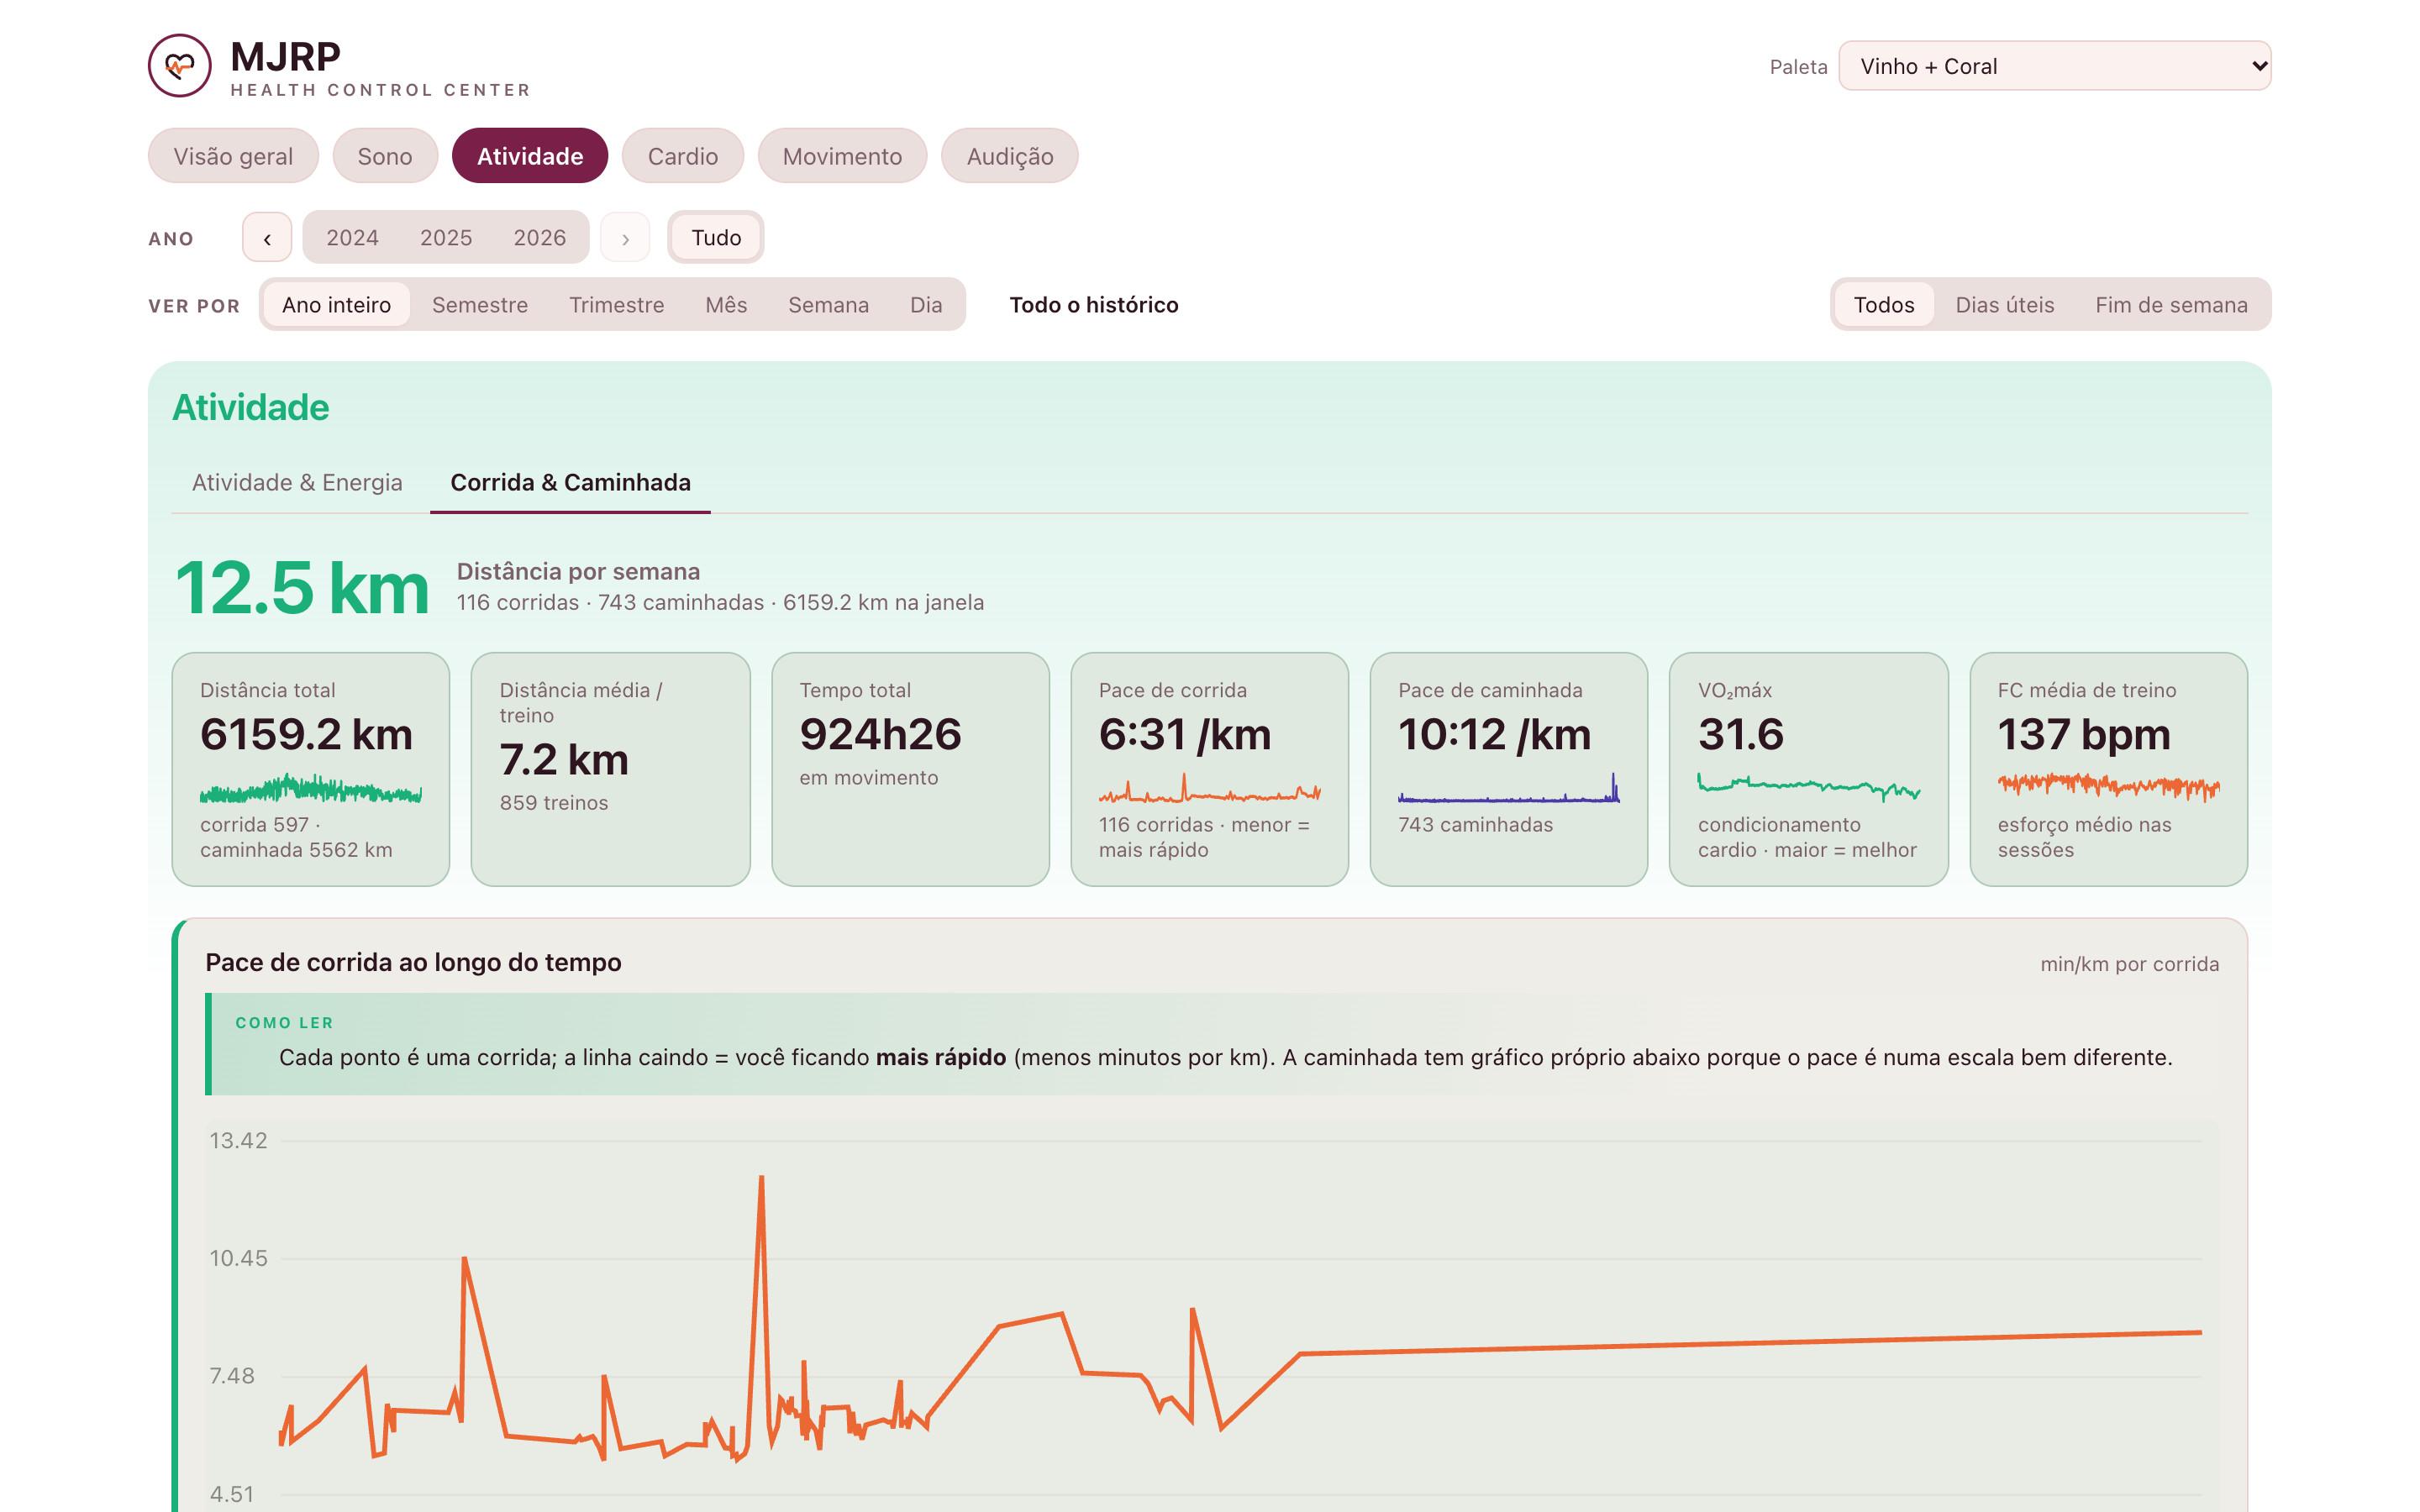
Running and walking: distance, pace and VO2 max, with the progress of each workout.